Tag Archives: #LibraryData

Library Stat of the Week #50 (Part 2): Where there are stronger and better used public and community libraries, more people read, more often

In the final post both of this mini-series on libraries and cultural data, and of our regular Library Stat of the Week posts, we return to a core function of libraries – to promote reading and access to books.

In the past three weeks, we have looked at data around how much households spend on books, as well as on wider data around participation in artistic and cultural activities. In each case, it appears that having more libraries, and using them better, is linked to greater spending and engagement.

This week, we look at data on how people spend their time, and in particular on how many people read regularly, and then how long they spend doing it.

For many, simply encouraging more reading is an end in itself, although of course this can also have positive impacts on issues such as wellbeing (a key issue during the pandemic!), literacy (skills can deteriorate if not used) and of course on the health of the wider cultural sector.

Once again, we are drawing on data from Eurostat, and in particular the Time Spent on Cultural Activities dataset (gathered between 2008 and 2015). Given its focus, it only covers countries in Europe, but offers insights that can apply elsewhere. As ever, data on libraries comes from the IFLA Library Map of the World, crossed with World Bank population data.

To set the scene, we can look already at what we know about people’s habits around reading, in particular throughout their lives.
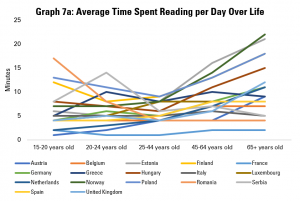
Graph 7a: Average Time Spent Reading per Day Over Life

Graph 7a does this by looking at the average time spent reading per day per person, broken down by different age groups. It shows that, in general, there is a U-shaped curve, with people reading more when they are younger and when they are older, with 25-44 year olds reading least on average.

There are exceptions within this. For example, Romanian 15-20 year olds on average read more than any others in Europe. However, older Romanians (aged 65+) are the second least regular readers. Meanwhile, young Austrians and Dutch are low readers, but their parents and grandparents on average spend a much more average amount of time reading.
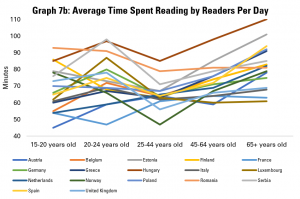
Graph 7b: Average Time Spent Reading by Readers Per Day

Graph 7b looks only at those people declaring that they do read regularly, and explores how long they spend doing this. While there is, again, a dip in average time spent reading among the 25-44 age group, this is less dramatic. Hungarian readers show up across all age groups as one of the nationalities that reads most when they do.
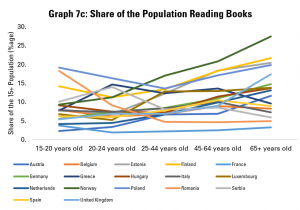
Graph 7c: Share of the Population Reading Books

The other driver of overall figures on how much people read on average is data about the share of the population reading at all. Graph 7c explores this, noting that the share of the population reading in general tends to be relatively stable, or drop between 15-20 and 25-44 year olds, and then rise relatively sharply among older groups. For example, while only an average share of younger Norwegians read, a larger share of older Norwegians than in any other country covered read. Similarly, from coming almost bottom of the class among younger groups, the older Dutch and Austrians come around average when it comes to the share of older people reading.
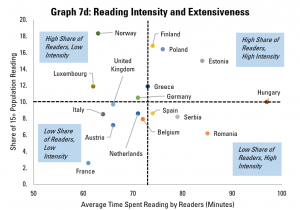
Graph 7d: Reading Intensity and Extensiveness

We can get an overview of the extensiveness (i.e. share of the overall population reading) and intensity (time spend reading by those who do) in Graph 7d, which looks at populations as a whole.

This shows us that Finland, Poland and Estonia do not just have an above average share of readers in the population, but those who do read tend to do so for longer. In contrast, Italy, France, Austria, the Netherlands, Belgium and the United Kingdom have both a below-average share of readers in the population, and those who do read do so for shorter times than average.

Finally, there is a contrast between Norway, Luxembourg and Germany (more readers, but reading for shorter times), and Spain, Serbia and Romania (fewer readers, but those who do read for longer). A separate analysis of the situation for different age groups could also be interesting here, in order to understand whether the main challenge in increasing reading is to allow more time for this, or to get more people reading in the first place.


Having looked at reading habits, it is now time to look at the relationship between libraries and reading.
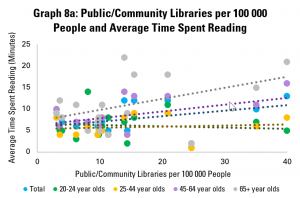
Graph 8a: Public/Community Libraries per 100 000 People and Average Time Spent Reading

Graph 8a looks at the availability of public and community libraries, as measured by the number of libraries per 100 000 people, compared to the average time spent reading by different age groups. It finds that there is a positive correlation for the population as a whole, mainly driven by older readers (those aged 45-64 and 65+). The link is less obvious for younger readers (aged 20-24 and 25-44).
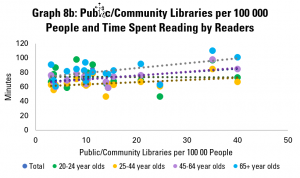
Graph 8b: Public/Community Libraries per 100 000 People and Time Spent Reading by Readers

Graph 8b looks at the amount of time spent reading by those who do read. This again shows a gentle, but positive correlation – in other words, in countries with more public and community libraries, those people who do read tend to spend more time doing so. Looking across age groups, the correlation is positive for all, although only slightly in the case of 20-24 year olds.
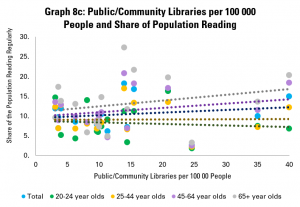
Graph 8c: Public/Community Libraries per 100 000 People and Share of Population Reading

Graph 8c looks at numbers of public and community libraries, and the share of the population in different age groups reading. Again, it finds weak but positive correlation between numbers of libraries and tendency to read, with stronger links for older groups. The picture is similar if we look only at countries with up to 20 public or community libraries per 100 000 people.

Overall, the story from this is that pure numbers of libraries are positively linked with how many people read, and how much they do, but not particularly strongly.
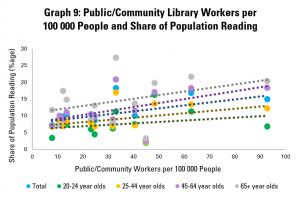
Graph 9: Public/Community Library Workers per  100 000 People and Share of Population Reading

Graph 9 goes a little further, looking rather at numbers of public and community library workers. This is, arguably, a stronger indicator of how much is being invested in the library field, as well as its ability to reach out to readers, welcome them, and support literacy.

This shows a more positive link between the strength of the library field and share of adults reading, with an increase of 10 library workers per 100 000 people tending to be linked to a rise of 1% in the share of the population reading (or 1000 people). This arguably makes sense – library staff have a key role in helping readers find books that interest them, and simply in making libraries into welcoming places.

Once again, the connection is stronger in older groups. Interestingly, it does not appear that those who do read spend more time doing so in countries with more public and community library workers.
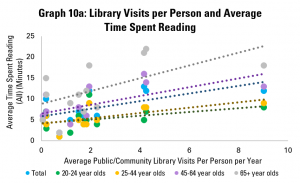
Graph 10a: Library Visits per Person and Average Time Spent Reading

Yet as in previous posts, the strength of the library field is only part of the picture – so too is how well it is used. Graph 10a does this, using data on average library visits per person per year. It shows a positive correlation between library visits and the length of time adults in general spend on reading per year, again with more positive links among older groups.
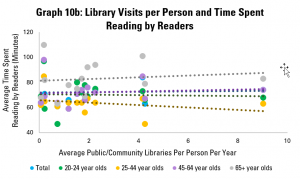
Graph 10b: Library Visits per Person and Time Spent Reading by Readers

Graph 10b looks at how long those adults who read do so on average. Here, the picture is similar to that in Graph 8b, with a weakly positive correlation. Again, it appears that there is little link between libraries and how long people spend reading.
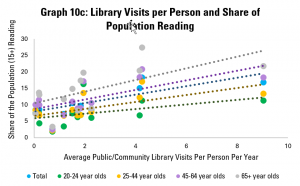
Graph 10c: Library Visits per Person and Share of Population Reading

Graph 10c however looks at the share of the adult population that reads, and once again displays a strong and positive correlation. Across the population as a whole, an increase of one library visit per person per year tends to be associated with a 1.28 percentage point rise in the share of the population reading.
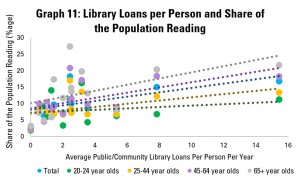
Graph 11: Library Loans per Person and Share of the Population Reading

Graph 11 repeats this last analysis, but with the average number of loans from public and community libraries per person per year. Again, there is a relatively strong positive correlation, with an extra library loan per person per year associated with a 0.6 point rise in the share of adults reading. As in Graph 10c, the connection holds for all age groups, although is stronger for older ones.


What can we conclude from this? First of all, that there are significant differences in reading habits across the European countries surveyed by Eurostat. High performance – as measured by a high average length of time spent reading per person – can be influenced by the number of people reading, and how long they read for. This performance matters, given the role of reading in maintaining and strengthening skills, in promoting wellbeing, and in providing demand for writing.

Looking at the connections with libraries, it seems that there are much stronger links between libraries and the share of the population reading than between libraries and how long people spend reading.

While correlation is not causality, the data shared here would support the argument that libraries can play a role in getting more people reading, and so in helping more people benefit in terms of skills and wellbeing. In particular, numbers of library staff appear to matter more than numbers of libraries, and levels of use of libraries have a stronger link still.

This would imply that a key focus of governments looking to boost reading will likely be to ensure that libraries are well-staffed and welcoming for all.

Throughout, the relationship between public and community libraries and numbers of people reading seems weakest in general for younger groups. To some extent, this may be because many younger people have access to university libraries (in the case of 20-24 year olds in particular), or just because of less inclination to read in general among 25-44 year olds. It can also be underlined that the importance of reading for skills is more important among older groups in any case.

Nonetheless, this does raise interesting questions about whether more can be done to increase reading among 25-44 year olds, and whether libraries can strengthen their role in this.


Find out more on the Library Map of the World, where you can download key library data in order to carry out your own analysis! See our other Library Stats of the Week! We are happy to share the data that supported this analysis on request.
Library Stat of the Week #40: School children without a room of their own or an internet connection rely more on libraries than their peers

Last week’s Library Stat of the Week started to explore the data available from the Organisation for Economic Cooperation and Development’s Programme for International Student Assessment (OECD PISA) regarding libraries and inequalities.

Based on a series of questions about the type of use that students (15 year olds taking part in the test) make of libraries, and how often, the PISA 2009 database provides an index of use of libraries.

By looking how different groups, on average, score on this index (running from -1 (no use) to +1 (extreme use)), it is possible to get a sense of whether there is relatively more or less dependence on libraries, according to different characteristics. As such, this provides valuable insights into how the benefits (or pain) of investment in (or cuts to) libraries may fall.

Following on from looking at differences in library usage between 15-year olds who have a 1st or 2nd generation immigrant background, as opposed to ‘native’ students, this week looks at two indicators of disadvantage – whether children have a room of their own at home or not, and whether they have household internet access or not.

Both of these are not only signs that a student may come from a less well-off background, but can also have a direct effect on their ability to benefit from education. The possibility to read and study quietly, and to make use of all that is available on the internet, are powerful.

We start by looking at differences between students who do, and do not, have a room of their own.

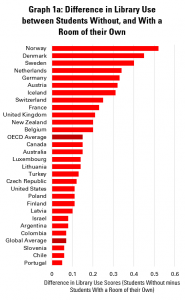
Graph 1a: Difference in Library Use between Students Without, and With a Room of their Own

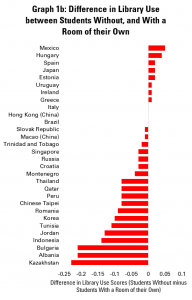
Graph 1b: Difference in Library Use between Students Without, and With a Room of their Own

Graphs 1a and 1b do this for each country for which data is available, giving a figure for the difference in the index of library use between students who do not, and do, have a room to themselves. A bar to the right shows that students who do not have such a private space make more use of libraries than students who do, while a bar to the left shows the contrary. The longer the bar, the bigger the difference.

Overall, it shows that in OECD countries, students who do not have a room for themselves score 0.15 points higher on average on the library usage index, while globally, the figure is 0.07. The biggest differences are to be seen in Scandinavian countries, as well as the Netherlands and Germany.

In 38 countries, students without a room of their own make more use of libraries than those who don’t. In 19 countries, it is the other way around, while in 3, there is no difference.

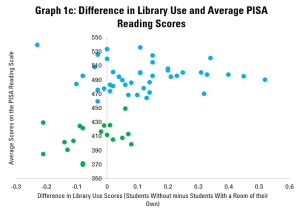
Graph 1c: Difference in Library Use and Average PISA Reading Scores

Graph 1c looks at whether there is much difference in this level of reliance on libraries depending on overall average reading scores. As in last week’s post, there appear to be two groups of countries – with richer countries which tend to score higher in blue, and developing countries tending to score lower in green.

Within each group, however, there is little correlation between the level of reliance on libraries by students without rooms of their own, and overall reading scores. In other words, it seems not to matter much whether a country is a high or low performer overall – those who are disadvantaged continue to make strong use of libraries.

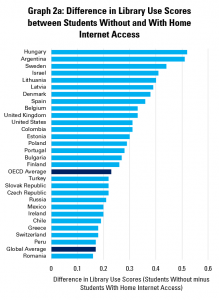
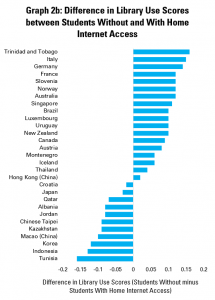
Graphs 2a and 2b replicate the analysis in Graphs 1a and 1b, but rather comparing scores for library use between students who do not, and who do, have internet access at home.


Graph 2a: Difference in Library Use Scores between Students Without and With Home Internet Access

Graph 2b: Difference in Library Use Scores between Students Without and With Home Internet Access

The differences here are even stronger, with an OECD average difference of 0.23 and a global average of 0.17, illustrating that globally children without home internet access rely more heavily on libraries than those who don’t.

In 48 countries out of 59, libraries appear to be more important for children without home internet access than for those with it, while only in 11 do children with internet access at home make more use of libraries than those who don’t. Interestingly, the countries with the highest differences in usage are different to the ones which come top when looking at students with rooms of their own.

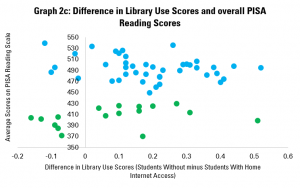
Graph cc: Difference in Library Use and Average PISA Reading Scores

Graph 2c then repeats the same logic as Graph 1c, looking at whether there is any reason to believe that the connection between lack of a home internet connection and library use is stronger or weaker depending on overall literacy scores.

The result – as in the case of Graph 1c – is that there is no clear connection, either in the group of lower performers or the group of higher performers. In other words, it does not matter much how well a country performs overall on literacy, library use tends to be higher among students without an internet connection at home.


The overall conclusion of this blog is that the evidence indicates that, in general, students who face barriers to benefitting from education due to their home environment tend to rely more on libraires. The corresponding argument is then that when library services are cut back, the pain will be higher for those who already have fewer resources or options.

Next week’s post will look at another dimension of inequality – the highest level of education achieved by parents.


Find out more on the Library Map of the World, where you can download key library data in order to carry out your own analysis! See our other Library Stats of the Week! We are happy to share the data that supported this analysis on request.
Library Stat of the Week #39: Globally, 1st and 2nd generation immigrant students make more intensive use of libraries than their native peers

One of the most worrying aspects of the COVID-19 pandemic and its consequences has been the deepening of the educational divide.

As highlighted in the Gates Foundation’s Goalkeepers report, there is a significant risk that the closure of school buildings will increase inequalities. In effect, groups that previously faced risks of worse educational outcomes face an even higher risk now.

While it is difficult to gather statistics on what is happening already, we can at least look back at available data to understand what factors might contribute to combatting this inequality. This can provide a basis for planning for the recovery afterwards.

Fortunately, the dataset from the Organisation for Economic Cooperation and Development’s Programme for International Student Assessment (OECD PISA) 2009 offers insights here.

We have already been able, in previous posts, to note the connection between access to a library and enjoyment of reading, and library availability and literacy skills.

This post looks to understand the connections between library use and just one potential vector of inequality – immigrant status.

As part of its data collection, as well as measuring levels of literacy and asking questions about library use, PISA 2009 also asked if the 15-year olds involved were first or second generation immigrants, or ‘native’ (i.e. all others). This allows us then to look at how far immigrant children, and the children of immigrants, depend on libraries.

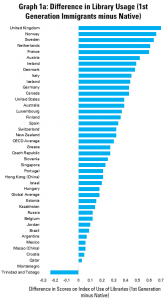
Graph 1a: Difference in Library Usage (1st Generation Immigrants minus Native)

Graph 1a looks at the situation for 1st generation immigrants, providing for each country a figure for the difference between immigrant and ‘native’ 15 year olds in terms of scores on the index of library use compiled by the OECD. This index is made up of figures related to how often students borrow books – for work or pleasure – or use the library in other ways, and runs from -1 to 1.

In the graph, a longer bar to the right indicates that 1st generation immigrant students use the library more intensively than natives. A bar to the left indicates that they use it less.

Overall, the conclusion is clear – in all but two countries, 15-year olds with a 1st generation immigrant background make much stronger use of libraries than native peers.

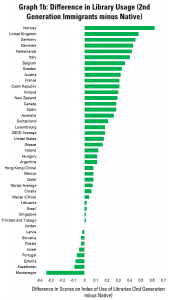
Graph 1b: Difference in Library Usage (1st Generation Immigrants minus Native)

Graph 1b replicates this analysis, but comparing 2nd generation immigrant students to ‘native’ students. While the effect is less strong, only 9 of the 43 countries for which data is available see 2nd generation immigrant students use libraries less than native students.

In both graphs, the United Kingdom and Norway share the top spots in terms of how much more immigrant students use libraries than natives.

These graphs also send a clear signal – libraries tend to be better used by students who can risk otherwise being left behind. It follows that any reduction in the possibility to use libraries is more likely to hurt students from immigrant backgrounds.


Graphs 1a and 1b allow us to look at individual countries. What about overall trends, for example when we compare these figures with how students perform in general on literacy, or how much native students use libraries?

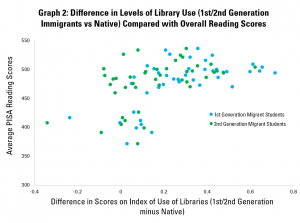
Graph 2: Difference in Levels of Library Use (1st/2nd Generation Immigrants vs Native) Compared with Overall Reading Scores

Graph 2 looks at the first of these questions, comparing the difference in library usage between 1st/2nd generation immigrant students and native peers (horizontal axis) and average scores for literacy for the whole population (vertical axis). Each dot represents a country.

Overall, there appears to be a positive correlation, with higher gaps in levels of library usage between immigrants and natives leading to higher overall reading scores.

In reality though, it perhaps makes more sense to see the countries presenting as falling into two groups – one of higher performers (usually richer countries) in the top right, and a group of less developed ones in the cluster in the middle-left.

In each of these groups, there is in fact little correlation between differences in library use and overall reading scores.

The lesson from this is then that the value of libraries to immigrant students does not depend on how well a country is performing in general – libraries seem to matter in both cases.

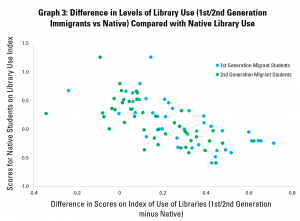
Graph 3: Difference in Levels of Library Use (1st/2nd Generation Immigrants vs Native) Compared with Native Library Use

Graph 3 repeats this, but this time, the vertical axis looks at levels of library use among native students. Here, there is a more obvious correlation, with differences in library usage higher in situations where native students are using them less.

To some extent, this is logical – if natives use libraries less, and immigrants use them to the same extent, of course the gap will be higher.

In policy terms, however, the implication is that even where there is less use of libraries by native students, they continue to be important to immigrant students.


As highlighted last week, there appears to be a strong link in almost all countries surveyed between library use and scores in the literacy component of PISA.

This week’s statistics indicate that, in turn, 1st and 2nd generation immigrant students tend to be more intensive library users than their native peers. This connection tends to hold, regardless of the overall level of literacy in the population, and even when native students use libraries less.

While of course correlation cannot be taken for causality, the data here supports the argument that ensuring access to libraries will be an important part of any effort to close the education divide.


Find out more on the Library Map of the World, where you can download key library data in order to carry out your own analysis! See our other Library Stats of the Week! We are happy to share the data that supported this analysis on request.
Library Stat of the Week #37: The connection between having access to a library and enjoyment of reading is strongest among children in Austria, France and Montenegro

Last week’s Library Stat of the Week looked at the connection between numbers of school libraries and levels of enjoyment of reading, combining data from IFLA’s Library Map of the World and the OECD’s PISA study.

As highlighted, simply counting the number of students per school library has limits as an indicator of the strength of the sector, as it depends heavily on the structure of schools as a whole.

It also does not account for the number of staff. As we have seen with public libraries in various previous posts, numbers of public and community library workers tend to be more closely linked to positive outcomes, such as literacy and equality.

An alternative perspective can come from digging deeper into the OECD’s PISA data. There is in fact a wealth of information specifically about libraries, based on their 2009 survey.

This post will therefore be the first of a series looking into the lessons we can gain from this source. Picking up on last week’s theme, this week’s blog looks at the links between students’ access to libraries – and use of them – and their level of enjoyment of reading.

As highlighted last week, this matters, as enjoyment of reading in turn is associated with higher overall reading performance.

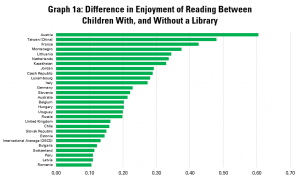
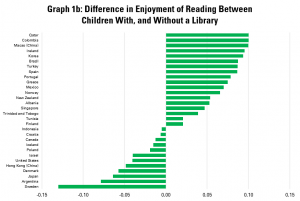
Graphs 1a and 1b look at the data on the difference in level of enjoyment of reading between students who do, and do not have access to a library.

Graph 1a: Difference in Enjoyment of Reading Between Children With and Without Library Access

Graph 1b: Difference in Enjoyment of Reading Between Children With and Without Library Access

Given the number of countries, it is divided into two graphs, with countries organised according to the gap in levels of enjoyment of reading – the first graph shows countries where the difference in levels of enjoyment is highest.

We can therefore see that this is highest in Austria, Taiwan (China), France and Montenegro. In almost all countries, those who have libraries tend to enjoy libraries more than those don’t.

There are some exceptions though. Yet simply having a library does not mean that it is used. In order to dig further, it makes sense to look at how different types of library use are linked with enjoyment of reading.

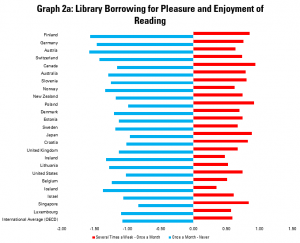
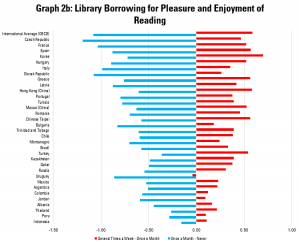
Graphs 2a and 2b therefore look at the connection between how regularly 15-year-olds borrow books for fun, and their level of enjoyment of reading.

Graph 2a: Library Borrowing for Pleasure and Level of Enjoyment of Reading


Graph 2b: Library Borrowing for Pleasure and Enjoyment of ReadingThese graphs indicate levels of enjoyment of reading amongst 15-year olds who borrow books only once a month, compared to those who do so never, and those who do so several times a week.

In these graphs a longer blue line to the left indicates that there is a bigger gap in enjoyment of reading between occasional borrowers (once a month) and those who never read. A longer red line to the right indicates a bigger gap in enjoyment between very regular borrowers (several times a week) and occasional ones (once a month).

It is not a surprise of course that there is a connection between the two here – in every country, those who borrow more enjoy reading more. Interestingly, in general, the gaps are bigger between occasional library borrowers and those who never borrow, rather than between the more frequent and the occasional borrowers.

It is in Finland, Germany, Austria and Switzerland where the links between regularity of borrowing books and enjoyment of reading are strongest. The implication here is that building up a habit of library borrowing can correlate with enjoyment of reading.

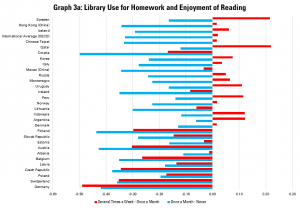
Graph 3a: Library Use for Homework and Enjoyment of Reading


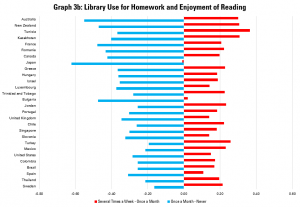
Graph 3b: Library Use for Homework and Enjoyment of ReadingGraphs 3a and 3b look at the links between levels of enjoyment of reading and how often students use the library to carry out homework.

In these graphs a longer blue line to the left indicates that there is a bigger gap in enjoyment of reading between those who occasionally use the library to do homework (once a month) and those who never do. A longer red line to the right indicates a bigger gap in enjoyment between very regular users of the library for homework (several times a week) and occasional ones (once a month).

As can be expected, the difference between level of enjoyment of reading between those who use libraries to do homework regularly, and those who don’t, are less marked than in the previous example.

Nonetheless, the connection is positive in all but one country, suggesting that having library spaces which are suitable for children to do homework is associated with more positive attitudes toward reading. Australia and New Zealand see the most positive connections in this regard.

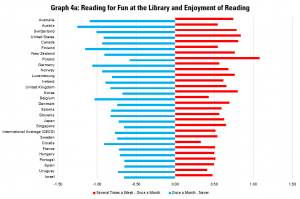
Graph 4a: Reading for Fun at the Library and Enjoyment of Reading


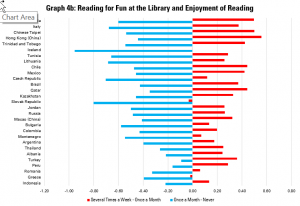
Graph 4b: Reading for Fun at the Library and Enjoyment of ReadingFinally, graphs 4a and 4b look at the links between enjoyment of reading and using the library to read for fun. Again, it is expected that more regular reading for fun at the library is linked to greater enjoyment of reading in general.

In these graphs a longer blue line to the left indicates that there is a bigger gap in enjoyment of reading between those who occasionally use the library to read for fun (once a month) and those who never do. A longer red line to the right indicates a bigger gap in enjoyment between very regular users of the library to read for fun (several times a week) and occasional ones (once a month).

In every country, the link is positive. As with borrowing of books, it also seems that there are bigger gaps between those who visit occasionally and those who never visit, than between the most regular users and more occasional ones.

Again, Australia, followed by Austria, Switzerland and the United States, has the most dramatic links between reading for fun at the library and enjoyment of reading overall.

This would support the argument that work to promote reading for fun in libraries can have a positive long-term pay-off.


In sum, the OECD data, even if a little old now, nonetheless provides valuable evidence of the connection between access to – and use of – libraries by school children, and enjoyment of reading.

Next week, we will look at how this translates into results in terms of literacy scores.


Find out more on the Library Map of the World, where you can download key library data in order to carry out your own analysis! See our other Library Stats of the Week! We are happy to share the data that supported this analysis on request.
Library Stat of the Week #35: Where there are more libraries offering internet access, being out of work is less likely to mean that people are also offline

Over the past weeks, we have looked at data around digital divides, and to what extent these cross over with other potential divides in society – rich and poor, women and men, old and young, and those with higher or lower formal qualifications.

It is valuable to look at this because the results help understand to what extent the internet can act as a bridge across divides, or rather deepen them further.

Ideally, access to the web should help those who are disadvantaged find new opportunities and information in order to improve their own lives, as well as those of the people around them.

However, where access is lacking, the fortunate – those who can use the internet – can get ahead, while those without drop further and further behind. This has been abundantly clear during the COVID-19 pandemic, with children lacking internet access unable to take part in education in the same way as their better connected peers.

It is also the case for those facing unemployment. People seeking work can do so much more easily with access to the internet, both to find openings, and to develop skills or access support.

People who are retired can also risk being cut off without internet access, for example limiting contact with friends and family, governments services, and eHealth possibilities. Older people may also feel less confident online, and feel the need for additional support.

In both cases, libraries can provide a great way to ensure that everyone can get online and make the most of the internet.

This blog therefore looks at digital divides between those in work on the one hand, and those who are unemployed or retired on the other. Once again, data on internet use comes from the OECD’s database on ICT Access and Usage by Households and Individuals, while data on libraries offering internet access comes from IFLA’s Library Map of the World.

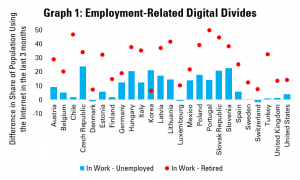
Graph 1: Employment-Related Digital Divides

Graph 1 looks at the state of the employment-related digital divide, for countries for which data is available. In almost all countries, a greater share of people in employment have used the internet in the last three months than those who are unemployed.

Only Denmark, Luxembourg and Switzerland buck the trend. In the Czech Republic, Hungary, Korea, Slovenia and Slovakia, the gap is over 20 percentage points.

Meanwhile, in no country are retired people more likely to use the internet than people in work, with the gap reaching over 40 points in Chile, Lithuania, Portugal and the Slovak Republic.

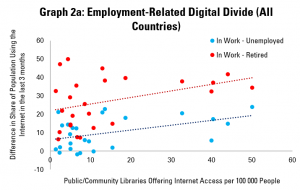
Graph 2a: Employment-Related Digital Divides and Internet Access in Public Libraries (All Countries)

Graph 2a crosses these figures with those for the number of public or community libraries offering internet access. Each dot represents a country, with the number of public or community libraries offering internet access on the horizontal (X) axis, and the gap in shares of the population using the internet (employed minus unemployed (blue dots) or retired (red dots)) on the vertical (Y) axis.

As with previous weeks, putting together the figures for all countries suggests that there is a positive correlation between the number of libraries offering internet access per 100 000 people, and the size of the digital divide – clearly not an encouraging result!

However, as we have seen in previous weeks, it is worth breaking out the results for Central and Eastern Europe, given the particular history of these countries

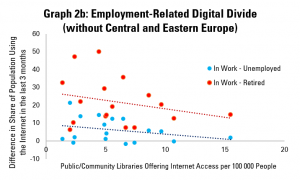
Graph 2b: Employment-Related Digital Divides and Internet Access in Public Libraries (without Central and Eastern Europe)

Graph 2b – using data from countries outside of Central and Eastern Europe – therefore shows a very different picture, in line with what we have seen in previous weeks. Where there are more libraries offering internet access, the digital divide faced by people who are out of work or retired, compared to their in-work peers, tends to be smaller.

Indeed, it appears that for every additional public library per 100 000 people offering access, the digital divide for the retired falls by 1 percentage point, and that for the unemployed falls by 0.55 percentage points.

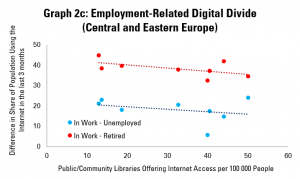
Graph 2c: Employment-Related Digital Divides and Internet Access in Public Libraries (Central and Eastern Europe)

Graph 2c repeats the analysis for countries in Central and Eastern Europe for which we have data, again indicating that where there are more libraries offering internet access, divides are smaller.


As always, the analysis carried out here cannot show causality – only correlation. However, it supports the argument that it is in societies with more libraries offering internet access that people who most need to access the internet face smaller barriers to doing so.

With COVID-19 risking exacerbating divides in societies, this is a powerful point to make in underlining why maintaining and broadening internet access through libraries matters more than ever.


Find out more on the Library Map of the World, where you can download key library data in order to carry out your own analysis! See our other Library Stats of the Week! We are happy to share the data that supported this analysis on request.
Library Stat of the Week #32: More can be done to close the digital access gap through public libraries

Libraries were often early adopters of digital technology, both for their own internal operations, and in support of their users.

By installing computer terminals and allowing for public access, they have given millions their first taste of the internet, in an environment where they could feel comfortable and supported in trying something new.

It is also well understood that that libraries can play a key role in bringing the unconnected online through providing this sort of public access. In some cases, this can act as a stepping stone towards private access, in others, an essential backstop for those unlikely ever to get a connection or device at home.

Frequently, those in the greatest need of this support are the poorest members of a society, who may not be able to commit to regular monthly payments, either for fixed or mobile internet. Instead, they can be stuck with pay-as-you-go options which end up more expensive.

This blog, the first in a sub-series, therefore looks at the connections between the digital access gap and the presence of libraries offering internet access. It draws on OECD statistics on internet access and usage for households and individuals, and IFLA’s own Library Map of the World.

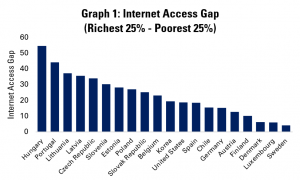
First of all, it is worth understanding the scope of the challenge. Graph 1 indicates the differences in internet access rates (use of the internet in the past three months) between people from households in the first (poorest) and fourth (richest) quartiles of the population.

Graph 1: Internet Access Gap (Richest 25% - Poorest 25%)

In this, only three countries – Denmark, Luxembourg and Sweden have a gap of less than 10 percentage points. Meanwhile, in Hungary, the gap is almost 55 percentage points – nearly 92% of people from richer households have accessed the internet, but barely 37% of those from poorer ones.

Interestingly, only one of the nine countries with the biggest gaps does not belong to the former Eastern bloc – we will return to this point later.

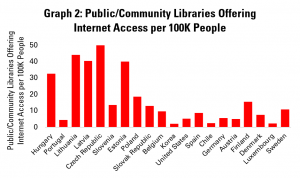
Graph 2: Public/Community Libraries Offering Internet access per 100 000 peopleGraph 2 displays (with the same order of countries as before) the number of public and community libraries offering public internet access per 100 000 people. The Czech Republic scores highest here, with just over 50 such libraries for every 100 000 people – that’s one for every 20 000 citizens.

Lithuania and Latvia also have more than 40 public libraries offering internet access per 100 000 people, and Estonia is only a short way behind.

Again, it is noticeable that most of the countries with high numbers of libraries offering internet access are from former Eastern Bloc countries.

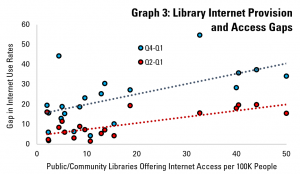
Graph 3: Library Internet Provision and Access GapsWe can cross these figures in Graph 3, which aims to look at the relationship between income-related internet access gaps and the availability of libraries offering access.

This shows a correlation between the number of libraries offering access and the gap in access between rich and poor. This applies both for the difference between the richest 25% and the poorest 25% (4th quartile minus 1st quartile), but also between those roughly in the middle and those at the bottom (2nd quartile minus 1st quartile)

On the one hand, this suggests that there is – fortunately – the infrastructure in place in order to help bridge this divide. The challenge, then, is to ensure that the possibilities that libraries provide turn into smaller access gaps in reality.

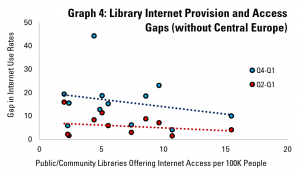
Graph 4: Library internet provision and access gaps (without Central Europe)As an additional step, Graph 4 carries out the same analysis, but not including countries from the former Eastern bloc.

Here, in fact, we can see that the correlation goes in another direction, suggesting that having more libraries offering internet access tends to be associated with a smaller gap between rich and poor in terms of internet access.


The analysis presented here raises interesting questions – what more can be done to realise the potential of connected libraries to close the gap between rich and poor in terms of internet access in countries of the former Eastern bloc? Can we take the more positive correlation between equality and the existence of libraries elsewhere as a positive?

Next week, we’ll explore the same question from different angles, including age and level of education.


Find out more on the Library Map of the World, where you can download key library data in order to carry out your own analysis! See our other Library Stats of the Week! We are happy to share the data that supported this analysis on request.
Library Stat of the Week #30: Countries with more librarians per student tend to have higher completion rates

In last week’s Library Stat of the Week, we explored in more depth the relationship between numbers of students and researchers as a share of the population, and numbers of academic and research librarians available to support them.

This helped to highlight the variation that exists between countries, and in particular which ones manage to combine a strong student or research sector with adequate librarian support.

Having figures for the number of students and researchers allows us to look at potential relationships between the level of library support they receive (calculated in terms of the number of students or researchers an individual academic or research librarian serves) and outcomes.

Therefore, in this week’s Library Stat of the Week, we will be using, for the first time, OECD data on tertiary education completion rates (as a measure of whether students receive the support necessary to finish their courses), and publishing and patenting data, as used in previous editions.

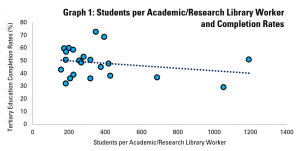
Graph 1: Academic/Research Library Workers per Student and Student Completion Rates

Graph 1 looks at completion rates (from OECD data, for students at all levels) and compares these with previously calculated figures about the number of students each librarian serves on average.

It finds a small, negative correlation between the two – in other words, the more students an academic/research librarian needs to serve, the lower the likelihood of the student completing their studies.

Clearly, other factors also play out – the OECD itself notes that where courses are shorter, completion rates are higher, and of course student financing also plays a role.

Nonetheless, while of course this sort of analysis cannot show causation, it does indicate that where students have greater access to librarians, they are more likely to complete their courses.


Turning to research, our previous posts looking at the relationship between libraries and innovation were based on numbers of academic/research library workers in the population as a whole.

This, while showing that more librarians tended to mean more publications and more patents, had the weakness of neglecting indicators of the strength of the research field as a whole.

To remedy this, we can now use figures from the last two weeks which calculate the number of researchers each academic/research library worker has to serve, giving a much better idea of whether more (or less) library support for research correlates with outcomes in terms of publications and patents.

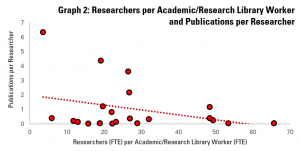
Graph 2: Academic/Research Library Workers per Researcher and Publications per Researcher

Graph 2 does this for publications, looking at whether researchers with more academic library support tend to publish more. To do this, we created a measure of number of publications per researcher by dividing figures for numbers of publications (World Bank) by those for the number of researchers (OECD).

The graph does indeed show this – when each academic/research library worker has fewer researchers to serve, the researchers tend to publish more articles each.

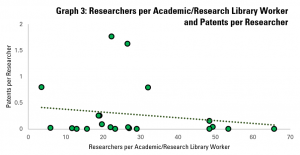
Graph 3: Academic/Research Library Workers per Researcher and Patents per Researcher

Graph 3 performs the same exercise for patents, using a figure for patents per researcher calculated again using World Bank and OECD data.

As with publications, this again shows a correlation, with countries where each academic or research library worker needs to serve fewer researchers each, on average, having higher rates of patenting per researcher.


As ever, correlation is not causation, although the analysis here does allow us to focus more precisely on the relationship between the strength of the academic and research library field and innovation performance per country.

While further research would be needed in order to demonstrate direct causality, these figures do allow us to say that those countries which provide stronger library support to students and researchers (as measured by numbers of students or researchers per academic and research library worker) tend to have higher student completion rates, and higher rates of publishing and patenting per researcher.


Find out more on the Library Map of the World, where you can download key library data in order to carry out your own analysis! See our other Library Stats of the Week! We are happy to share the data that supported this analysis on request.