Tag Archives: digital divide

Digital Social Justice: A Natural Library Mission

The theme of this year’s World Social Justice Day is ‘A Call for Social Justice in the Digital World’.

The focus is timely – the last decades have seen digital technologies play a more and more central role in the economy, shaping the way we work, and the type of work we do.

As the United Nations’ own note for this year’s commemoration underlines, this has brought new opportunities for employment and entrepreneurship which, previously, would not have been imaginable. It highlights that those who are left offline therefore risk enjoying fewer opportunities, while others move further ahead.

However, there are also concerns, notably around platform-based business models and their impacts, both on competitors and their own employees or contractors. Within the workplace, tracking of employee activity raises the prospect of greater surveillance and reduced wellbeing.

These too risk driving inequalities between companies and between individuals by giving some greater opportunities than others.

As such, the UN makes a case for efforts to define responses and actions, firstly to tackle the imbalance between those who are off- and online, but also to address challenges that give more possibilities in the digital world to some than to others.

But what then about libraries?

As this blog will argue, efforts to build digital social justice today can take inspiration from the long-standing work of libraries to promote information social justice (a term explored in the next section). Furthermore, our institutions are well placed not only to contribute to practical efforts in the field, and to support further reflection.


Information Social Justice

While it may not often be talked about in these terms, the work of libraries to provide universal access to information is could be described as promoting information social justice.

This work is about giving everyone the opportunity to access the information they need to fulfil their potential, either through collections within a library, or through document supply.

It is also about giving everyone the possibility to use information effectively, through the application of copyright exceptions that would otherwise put many works out of reach, and through the provision of skills and support.

Yet it is not just a question of opening the doors to all, but also taking proactive efforts. Public libraries in particular have a mission, as set out in the UNESCO-IFLA Public Library Manifesto, to make particular efforts to ensure that everyone benefits.

This work supports employment and entrepreneurship for all, as set out in our research piece for this day two years ago, alongside a wide variety of other economic, social, cultural and civic goals.

Digital Social Justice Implementors

Increasingly, the work of libraries to promote information social justice takes place through digital means of course.

Connecting libraries to the internet and opening access to users has allowed our institutions to provide access to a greater volume of information. At the same time, it has also required further work to help users improve their ability to navigate through what is there.

This can stretch from helping people to look for work online and prepare digital CVs, to holding coding classes that can open the way to new jobs. The need for more advanced information literacy, in particular to understand how information is created, shared and presented, is clear.

Crucially, these services are provided in a way that looks to respect the principle of universality, with efforts to ensure that no-one should face unjustifiable barriers to accessing and using digital tools to improve their own lives.

The role of libraries in delivering on effective connectivity and digital skills strategies has already been recognised by many governments. Nonetheless, this is not to say that the situation is perfect everywhere. There is always space to share ideas, innovate and improve practice in order to reach further.

Joining the Debate

In addition to their own efforts, a key determinant of libraries’ ability to contribute to digital social justice will be the choices made by governments themselves.

The experiences – and values – of libraires can have much to contribute in discussions around how the internet should operate in order to promote the ability of everyone to participate actively in economic, social, cultural and civic life.

IFLA has engaged on these questions for a number of years, with statements on privacy, net neutrality, the right to be forgotten, digital literacy, internet shutdowns and beyond. In each case, there has been an emphasis on how to ensure that restrictions on universal access to information are minimised, protecting the capacity of all people to draw on information without unjustified restrictions.

In each case, poor decisions can leave those with fewer resources exposed to greater exploitation of their personal data, a narrower range of materials available (at reasonable speeds), and less ability to exploit the opportunities the internet presents.

Libraries also bring in extensive experience of acting as ‘platforms’, providing access to works by others in an equitable fashion. To do this, they must negotiate questions around balancing human rights, respecting the law, and accountability.

In doing so, they rely on professional judgement and ethics that could contribute much to discussions today around the role of platforms.

Conclusion

With digital technology advancing rapidly, the combination of measures needed to ensure digital social justice – from personal connectivity and skills to wider regulation – are evolving, even if the goals of social justice are lasting. This in turn requires a process of ongoing learning and action not only amongst governments, but also among all relevant stakeholders.

In this process, libraries have much to offer, both in delivering on fundamentals such as internet access and providing a platform for skills development, and in contributing experience and expertise to wider discussions.

Library Stat of the Week #43: Not everyone counted as having internet access has the speed or device needed to use it

This week and next, the Internet Governance Forum is taking place, fittingly enough, online.

This is an opportunity to return to data about connectivity in order to provide more background on the role of libraries in helping people get the most of the internet.

The Forum itself has a strong focus on the internet as a driver of inclusion. Clearly, the most immediate way of looking at this is by counting the number of people or households which do have access.

However, simply having a connection is not always enough. When this is not fast enough (for example, where it is still a dial-up connection), or where the household does not have a computer, there is less potential to realise the full potential of the internet.

Clearly, during the pandemic, this has been a major issue, with low speeds or data caps, and a lack of (enough) computers making it more difficult for people to learn, work, or apply for support.

Libraries have long provided a valuable complement to home access, offering higher connection speeds and the necessary hardware to use the internet, even in countries which are nearing 100% connectivity officially.

To get a better idea of the numbers, we look this week at Organisation for Economic Cooperation and Development data about internet access, and in particular the differences in the shares of people counted as having internet access, and those with broadband access (i.e. higher speed internet) and computers (the devices to use it).

Graph 1: When Access Doesn't Mean Access...

Graph 1 looks at the share of households in the overall population which count as being officially connected, but which in reality lack the key conditions to use the internet – a good quality connection and a computer.

In this graph, a longer bar indicates a higher share of households in the categories set out (connected to the internet, but not with a computer, or connected but without broadband)

In the median country, about 1 in 40 households are connected but do not have a computer, although in a number of countries, this share is much higher, reaching over 1 in 5 households in Turkey, Chile and Korea.

Meanwhile, about 1 in 100 households are connected to the internet, but do not have a broadband, but this rises to around 1 in 14 in France and Brazil.


Do these numbers stand throughout the population, or does the challenge of inadequate home internet access affect some groups more than others?

To start, it’s worth reminding ourselves of the degree to which coming from a richer or poorer household affects the likelihood of having a good internet connection and a computer.

C:\Users\stephen\Downloads\LSOTW43Graph2b.pngGraph 2b: Inequalities in Internet, Broadband, Computer Access


Graphs 2a and 2b do this, showing the gaps in the share of households in the top and bottom income quartiles (i.e. the richest and poorest quarters) which have internet access, broadband, or a computer.

In these graphs, each dot represents the difference in the share of richer and of poorer households having access.

These show big gaps, in particular in computer access, with a difference of over 50 percentage points between rich and poor in Brazil, Chile, Costa Rica, Hungary, Korea, Latvia, Lithuania, Portugal and Slovenia. Iceland, the Netherlands, Norway, and Sweden tend to have the lowest inequalities here.

Graph 3: Households with Internet Access, but Without Broadband

Graph 3 repeats the analysis in Graph 1, but focusing on people with ‘slow’ connections (i.e. connected but without broadband). It breaks out the figures for poorer and richer households, in order to establish whether people in poorer households are more likely to be stuck with such ‘slow’ connections than richer people.

This does appear to be the case in almost all countries. For example, in Germany, Poland, France and Brazil, over 4% of all poorer households are stuck with slower connections. This represents 5% of all those people in poorer households classed as connected in Germany, around 10% in France and Poland, and nearly 17% in Brazil.

Graph 4: Households with Connections, but Without a Computer

Graph 4 does the same, but looking at households which are connected, but which do not have computers. It is even clearer here that richer households are less likely to find themselves in the situation of being connected, but not having a device, than poorer households.

In Korea, Chile, Costa Rica and Brazil, over 25% of poorer households are in this situation of ‘device-less connectivity’. In effect, 2/3 of poorer Korean households which are officially connected to the internet do not have devices, while the figure is around 50% in Costa Rica and Brazil, and over 1/3 in Chile.


What lessons from this for libraries? Next week, we will combine some of this data with information about libraries offering internet access. What is does indicate, already, is that there is not only a significant issue in terms of inequality in internet access, but that even where households are officially connected, we need to look hard at whether they have the speed and devices to make this meaningful.

This is of course not to mention the more human aspects – skills, confidence, support – which may also hold people back from using the internet fully as well!

As highlighted in the introduction, libraries have a role not only in providing connectivity for the unconnected, but also a solution when this home connectivity is not good enough. As this post shows, in many countries, addressing this need is a real issue.


Find out more on the Library Map of the World, where you can download key library data in order to carry out your own analysis! See our other Library Stats of the Week! We are happy to share the data that supported this analysis on request.

Library Stat of the Week #40: School children without a room of their own or an internet connection rely more on libraries than their peers

Last week’s Library Stat of the Week started to explore the data available from the Organisation for Economic Cooperation and Development’s Programme for International Student Assessment (OECD PISA) regarding libraries and inequalities.

Based on a series of questions about the type of use that students (15 year olds taking part in the test) make of libraries, and how often, the PISA 2009 database provides an index of use of libraries.

By looking how different groups, on average, score on this index (running from -1 (no use) to +1 (extreme use)), it is possible to get a sense of whether there is relatively more or less dependence on libraries, according to different characteristics. As such, this provides valuable insights into how the benefits (or pain) of investment in (or cuts to) libraries may fall.

Following on from looking at differences in library usage between 15-year olds who have a 1st or 2nd generation immigrant background, as opposed to ‘native’ students, this week looks at two indicators of disadvantage – whether children have a room of their own at home or not, and whether they have household internet access or not.

Both of these are not only signs that a student may come from a less well-off background, but can also have a direct effect on their ability to benefit from education. The possibility to read and study quietly, and to make use of all that is available on the internet, are powerful.

We start by looking at differences between students who do, and do not, have a room of their own.

Graph 1a: Difference in Library Use between Students Without, and With a Room of their Own

Graph 1b: Difference in Library Use between Students Without, and With a Room of their Own

Graphs 1a and 1b do this for each country for which data is available, giving a figure for the difference in the index of library use between students who do not, and do, have a room to themselves. A bar to the right shows that students who do not have such a private space make more use of libraries than students who do, while a bar to the left shows the contrary. The longer the bar, the bigger the difference.

Overall, it shows that in OECD countries, students who do not have a room for themselves score 0.15 points higher on average on the library usage index, while globally, the figure is 0.07. The biggest differences are to be seen in Scandinavian countries, as well as the Netherlands and Germany.

In 38 countries, students without a room of their own make more use of libraries than those who don’t. In 19 countries, it is the other way around, while in 3, there is no difference.

Graph 1c: Difference in Library Use and Average PISA Reading Scores

Graph 1c looks at whether there is much difference in this level of reliance on libraries depending on overall average reading scores. As in last week’s post, there appear to be two groups of countries – with richer countries which tend to score higher in blue, and developing countries tending to score lower in green.

Within each group, however, there is little correlation between the level of reliance on libraries by students without rooms of their own, and overall reading scores. In other words, it seems not to matter much whether a country is a high or low performer overall – those who are disadvantaged continue to make strong use of libraries.

Graphs 2a and 2b replicate the analysis in Graphs 1a and 1b, but rather comparing scores for library use between students who do not, and who do, have internet access at home.


Graph 2a: Difference in Library Use Scores between Students Without and With Home Internet Access

Graph 2b: Difference in Library Use Scores between Students Without and With Home Internet Access

The differences here are even stronger, with an OECD average difference of 0.23 and a global average of 0.17, illustrating that globally children without home internet access rely more heavily on libraries than those who don’t.

In 48 countries out of 59, libraries appear to be more important for children without home internet access than for those with it, while only in 11 do children with internet access at home make more use of libraries than those who don’t. Interestingly, the countries with the highest differences in usage are different to the ones which come top when looking at students with rooms of their own.

Graph cc: Difference in Library Use and Average PISA Reading Scores

Graph 2c then repeats the same logic as Graph 1c, looking at whether there is any reason to believe that the connection between lack of a home internet connection and library use is stronger or weaker depending on overall literacy scores.

The result – as in the case of Graph 1c – is that there is no clear connection, either in the group of lower performers or the group of higher performers. In other words, it does not matter much how well a country performs overall on literacy, library use tends to be higher among students without an internet connection at home.


The overall conclusion of this blog is that the evidence indicates that, in general, students who face barriers to benefitting from education due to their home environment tend to rely more on libraires. The corresponding argument is then that when library services are cut back, the pain will be higher for those who already have fewer resources or options.

Next week’s post will look at another dimension of inequality – the highest level of education achieved by parents.


Find out more on the Library Map of the World, where you can download key library data in order to carry out your own analysis! See our other Library Stats of the Week! We are happy to share the data that supported this analysis on request.

Library Stat of the Week #35: Where there are more libraries offering internet access, being out of work is less likely to mean that people are also offline

Over the past weeks, we have looked at data around digital divides, and to what extent these cross over with other potential divides in society – rich and poor, women and men, old and young, and those with higher or lower formal qualifications.

It is valuable to look at this because the results help understand to what extent the internet can act as a bridge across divides, or rather deepen them further.

Ideally, access to the web should help those who are disadvantaged find new opportunities and information in order to improve their own lives, as well as those of the people around them.

However, where access is lacking, the fortunate – those who can use the internet – can get ahead, while those without drop further and further behind. This has been abundantly clear during the COVID-19 pandemic, with children lacking internet access unable to take part in education in the same way as their better connected peers.

It is also the case for those facing unemployment. People seeking work can do so much more easily with access to the internet, both to find openings, and to develop skills or access support.

People who are retired can also risk being cut off without internet access, for example limiting contact with friends and family, governments services, and eHealth possibilities. Older people may also feel less confident online, and feel the need for additional support.

In both cases, libraries can provide a great way to ensure that everyone can get online and make the most of the internet.

This blog therefore looks at digital divides between those in work on the one hand, and those who are unemployed or retired on the other. Once again, data on internet use comes from the OECD’s database on ICT Access and Usage by Households and Individuals, while data on libraries offering internet access comes from IFLA’s Library Map of the World.

Graph 1: Employment-Related Digital Divides

Graph 1 looks at the state of the employment-related digital divide, for countries for which data is available. In almost all countries, a greater share of people in employment have used the internet in the last three months than those who are unemployed.

Only Denmark, Luxembourg and Switzerland buck the trend. In the Czech Republic, Hungary, Korea, Slovenia and Slovakia, the gap is over 20 percentage points.

Meanwhile, in no country are retired people more likely to use the internet than people in work, with the gap reaching over 40 points in Chile, Lithuania, Portugal and the Slovak Republic.

Graph 2a: Employment-Related Digital Divides and Internet Access in Public Libraries (All Countries)

Graph 2a crosses these figures with those for the number of public or community libraries offering internet access. Each dot represents a country, with the number of public or community libraries offering internet access on the horizontal (X) axis, and the gap in shares of the population using the internet (employed minus unemployed (blue dots) or retired (red dots)) on the vertical (Y) axis.

As with previous weeks, putting together the figures for all countries suggests that there is a positive correlation between the number of libraries offering internet access per 100 000 people, and the size of the digital divide – clearly not an encouraging result!

However, as we have seen in previous weeks, it is worth breaking out the results for Central and Eastern Europe, given the particular history of these countries

Graph 2b: Employment-Related Digital Divides and Internet Access in Public Libraries (without Central and Eastern Europe)

Graph 2b – using data from countries outside of Central and Eastern Europe – therefore shows a very different picture, in line with what we have seen in previous weeks. Where there are more libraries offering internet access, the digital divide faced by people who are out of work or retired, compared to their in-work peers, tends to be smaller.

Indeed, it appears that for every additional public library per 100 000 people offering access, the digital divide for the retired falls by 1 percentage point, and that for the unemployed falls by 0.55 percentage points.

Graph 2c: Employment-Related Digital Divides and Internet Access in Public Libraries (Central and Eastern Europe)

Graph 2c repeats the analysis for countries in Central and Eastern Europe for which we have data, again indicating that where there are more libraries offering internet access, divides are smaller.


As always, the analysis carried out here cannot show causality – only correlation. However, it supports the argument that it is in societies with more libraries offering internet access that people who most need to access the internet face smaller barriers to doing so.

With COVID-19 risking exacerbating divides in societies, this is a powerful point to make in underlining why maintaining and broadening internet access through libraries matters more than ever.


Find out more on the Library Map of the World, where you can download key library data in order to carry out your own analysis! See our other Library Stats of the Week! We are happy to share the data that supported this analysis on request.

Library Stat of the Week #34: Where there are more public libraries offering internet access, people with fewer formal qualifications face a smaller digital divide

In the last couple of posts, we have looked at the relationship between the availability of public libraries offering internet access and digital divides.

Using data from the Organisation for Economic Cooperation and Development (OECD), we have looked at gaps in levels of internet use among richer and poorer households, between older and younger people, and between women and men.

In each case, it appears that where there are more public libraries offering internet access, these gaps are smaller.

This week’s post looks at digital divides between people with lower and higher levels of formal education.

Clearly, education is often a key determinant of economic success later in life. Yet not everyone has the possibility to gain qualifications early on, for a variety of reasons. What is important then is to have a second chance – an opportunity to learn in other ways, and even gain qualifications.

We have already shown that societies with more public library workers tend to have higher shares of adults in general engaged in lifelong learning (Library Stat of the Week #20). This also highlighted that in general, where there are more public library workers, the gap in rates of participation in lifelong learning between the high- and low-educated is less.

The internet is a key way of finding and accessing learning opportunities. Especially during COVID-19, but clearly also before, online learning has become more and more important.

Therefore, looking at the digital divide between those with high and low levels of education (i.e. the difference in percentages accessing the internet at least once in the last 3 months), we can also build up a sense of whether libraries may be helping ensure that those with fewer qualifications are getting a second chance.

Once again, data on internet use comes from the OECD’s database on ICT Access and Usage by Households and Individuals, while data on libraries offering internet access comes from IFLA’s Library Map of the World.

Graph 1: Education-Related Digital Divides

Graph 1 looks at the state of the education-related digital divide in general. Looking at the population as a whole, some countries demonstrate dramatic differences.

For example, there is a gap of over 40 percentage points in levels of internet use among people with high and low levels of formal education in Hungary, Mexico and Portugal. It is only in Denmark, Estonia, Luxembourg, Sweden and Switzerland where the gap is smaller than 10 percentage points.

In every single country, the gaps are wider among people aged 55-74 than among younger generations. Gaps are also wider among 25-54 year olds than among 16-24 year olds in every country except Luxembourg.

The size of gaps matters, and arguably more among older workers. In general, it can be more difficult for older workers to find new jobs if they become unemployed. The internet can help address this, if it is available.

More broadly, this raises the possibility that not only does having less formal education mean that people are less likely to be internet users, but that in turn, difficulties in accessing the internet may stand in the way of efforts to find and make use of opportunities to improve lives, creating a vicious circle.


Graph 2a: Education-Related Digital Divides and Public Internet Access in Libraries (All Countries)

Graph 2a compares these figures (including broken down by age group) with those for the number of public libraries per 100 000 people offering internet access.

The finding is not necessarily encouraging – where there are more public libraries, the gaps are wider. However, this is also in keeping with previous analyses when we have looked at Central and Eastern Europe (which has its own particular history) and all other countries together.

Graphs 2b and 2c look at the ‘rest of the world’ and Central and Eastern Europe separately.

Graph 2b: Education-Related Digital Divides and Public Internet Access in Libraries (without Central and Eastern Europe)

Graph 2b – looking at all countries for which data is available, except those in Central and Eastern Europe – shows a correlation between having more libraries offering internet access, and smaller digital divides.

Indeed, it appears that on average, for every 1 extra public library per 100 000 people offering internet access, the digital divide drops by 1.7 points. Looking only at the digital divide among older people, the divide shrinks by 2.2 points.

Graph 2c looks at Central and Eastern Europe in particular, and finds similar conclusions, at least for people aged 25 and above, and for the population as a whole. Once again, where there are more public libraries offering internet access, the education-related digital divide is smaller.


As we underline in almost all of these posts, correlation does not mean causality. It is of course possible that the sort of society that invests in libraries also invests in the sort of minimum income support that ensures that everyone has a good chance of being able to buy a computer and internet connection.

Nonetheless, sample-based work, as well as anecdotal evidence, does suggest that libraries can provide a vital opportunity for those with fewer resources to get online, and access second chances – for education, employment, and simply personal fulfilment.

The results presented here do support the argument that libraries can help prevent the digital divide becoming a vicious circle.

Next week, we’ll be looking at the digital divides that exist between people who are in work, and those who are unemployed, or retired.


Find out more on the Library Map of the World, where you can download key library data in order to carry out your own analysis! See our other Library Stats of the Week! We are happy to share the data that supported this analysis on request.

Library Stat of the Week #32: More can be done to close the digital access gap through public libraries

Libraries were often early adopters of digital technology, both for their own internal operations, and in support of their users.

By installing computer terminals and allowing for public access, they have given millions their first taste of the internet, in an environment where they could feel comfortable and supported in trying something new.

It is also well understood that that libraries can play a key role in bringing the unconnected online through providing this sort of public access. In some cases, this can act as a stepping stone towards private access, in others, an essential backstop for those unlikely ever to get a connection or device at home.

Frequently, those in the greatest need of this support are the poorest members of a society, who may not be able to commit to regular monthly payments, either for fixed or mobile internet. Instead, they can be stuck with pay-as-you-go options which end up more expensive.

This blog, the first in a sub-series, therefore looks at the connections between the digital access gap and the presence of libraries offering internet access. It draws on OECD statistics on internet access and usage for households and individuals, and IFLA’s own Library Map of the World.

First of all, it is worth understanding the scope of the challenge. Graph 1 indicates the differences in internet access rates (use of the internet in the past three months) between people from households in the first (poorest) and fourth (richest) quartiles of the population.

Graph 1: Internet Access Gap (Richest 25% - Poorest 25%)

In this, only three countries – Denmark, Luxembourg and Sweden have a gap of less than 10 percentage points. Meanwhile, in Hungary, the gap is almost 55 percentage points – nearly 92% of people from richer households have accessed the internet, but barely 37% of those from poorer ones.

Interestingly, only one of the nine countries with the biggest gaps does not belong to the former Eastern bloc – we will return to this point later.

Graph 2: Public/Community Libraries Offering Internet access per 100 000 people
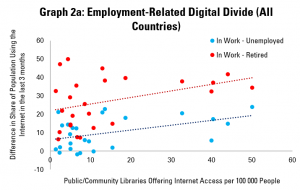
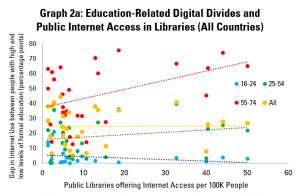
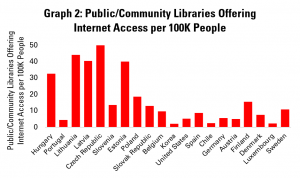
Graph 2 displays (with the same order of countries as before) the number of public and community libraries offering public internet access per 100 000 people. The Czech Republic scores highest here, with just over 50 such libraries for every 100 000 people – that’s one for every 20 000 citizens.

Lithuania and Latvia also have more than 40 public libraries offering internet access per 100 000 people, and Estonia is only a short way behind.

Again, it is noticeable that most of the countries with high numbers of libraries offering internet access are from former Eastern Bloc countries.

Graph 3: Library Internet Provision and Access Gaps
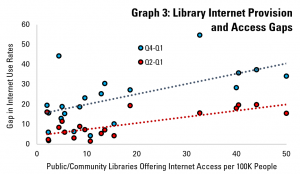
We can cross these figures in Graph 3, which aims to look at the relationship between income-related internet access gaps and the availability of libraries offering access.

This shows a correlation between the number of libraries offering access and the gap in access between rich and poor. This applies both for the difference between the richest 25% and the poorest 25% (4th quartile minus 1st quartile), but also between those roughly in the middle and those at the bottom (2nd quartile minus 1st quartile)

On the one hand, this suggests that there is – fortunately – the infrastructure in place in order to help bridge this divide. The challenge, then, is to ensure that the possibilities that libraries provide turn into smaller access gaps in reality.

Graph 4: Library internet provision and access gaps (without Central Europe)
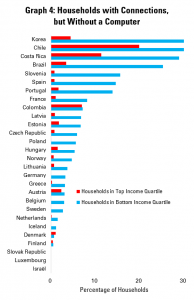
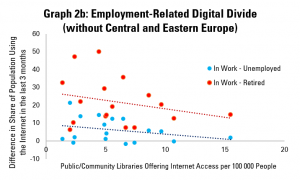
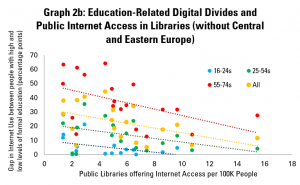
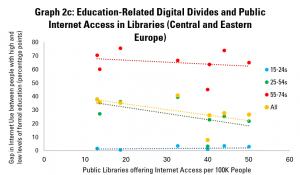
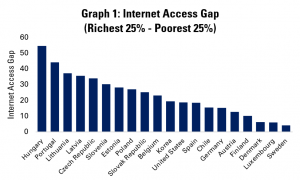
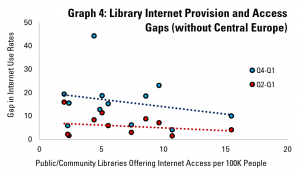
As an additional step, Graph 4 carries out the same analysis, but not including countries from the former Eastern bloc.

Here, in fact, we can see that the correlation goes in another direction, suggesting that having more libraries offering internet access tends to be associated with a smaller gap between rich and poor in terms of internet access.


The analysis presented here raises interesting questions – what more can be done to realise the potential of connected libraries to close the gap between rich and poor in terms of internet access in countries of the former Eastern bloc? Can we take the more positive correlation between equality and the existence of libraries elsewhere as a positive?

Next week, we’ll explore the same question from different angles, including age and level of education.


Find out more on the Library Map of the World, where you can download key library data in order to carry out your own analysis! See our other Library Stats of the Week! We are happy to share the data that supported this analysis on request.