Tag Archives: internet access

If we’re serious about inclusive digital education, school connectivity initiatives must expand to include library connectivity

Among the key themes on the table at the Transforming Education Summit taking place currently in New York is that of how to make the most of the promise of digital to help achieve education goals.

Of course, this is a multi-dimensional question. Education technology (EdTech) companies will promote digital programmes and products that claim to offer simple solutions to many of the challenges the sector is said to face.

Others will underline that too great a focus on the digital can lead to an undervaluation of the importance of access to a real teacher, in a real space. Digital tools should support the work of educators, not replace them.

Parallel concerns focus on the costs of digital in terms of privacy and choice, as well as how it can undermine freedoms granted by educational exceptions in copyright law. Both are areas which will need resolution if digital is to realise its potential to transform education for the better.

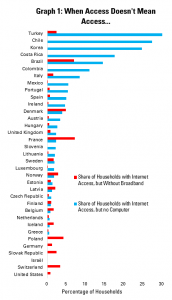
However, these questions are of course irrelevant if there is no connectivity in the first place.

This is the challenge that initiatives such as GIGA look to overcome. This is an exciting project launched by UNICEF and the International Telecommunications Union, with the goal of ensuring that every school around the world is connected.

It works by a combination of mapping the current situation of school connectivity, and then mobilising sources of finance, equipment and expertise in order to get schools online.

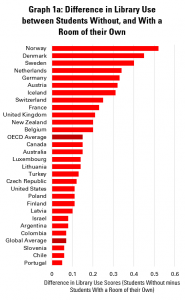
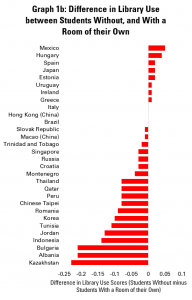
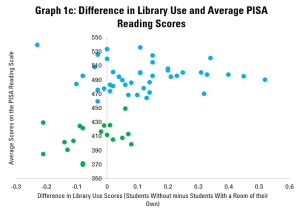
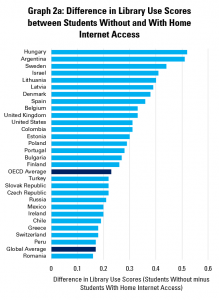
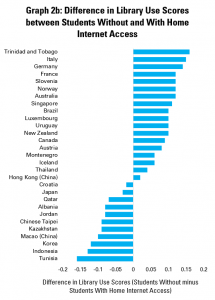
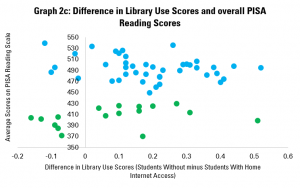
For libraries, as institutions with a clear educational mission, anything that contributes to making education more effective and inclusive is of course a good thing.

However, we also owe it to ourselves to point out that if leaders, nationally and internationally, are serious about realising the potential of digital to support education, it would make sense to expand the focus of any school connectivity programme to public and community libraries.

There are a number of key reasons for this.

First of all, there is the role of libraries in supporting the work of schools. Libraries and librarians have a critical role in complementing the work of teachers through provision of materials for teaching, as well as offering students possibilities to expand their horizons and practice literacy.

While such a role is often associated with school libraries, public and community libraries crucially also act here. In some countries, indeed, they formally fulfil the role of school libraries. Elsewhere, they support literacy and discovery, as well as providing a space for homework, without such an official link. This can be particularly important for children who do not benefit from space at home or strong parental support.

Clearly, these are roles that are supported when libraries can provide internet access, expanding both the range of content and services that can be offered, and making them far more interesting as a place to do homework.

Secondly, libraries have a well-established role in supporting school-readiness. The value of exposing children to a range of language in their early years is well recognised, stimulating development.

Of course, much of this work takes place in person, through activities such as story-times and those based on play. However, again, access to wider resources, including recorded story-times online, or ideas and suggestions for other means of supporting learning, has a real value. This can be particularly the case for materials in minority languages for example.

Once again, internet connectivity can play a big role here, broadening the range of support that they can offer to families with younger children, but also allowing them to draw on new ideas to maximise effectiveness.

Finally, although far from the least important, is the role of libraries as portals, partners and providers in lifelong education.

Libraries can both provide a space where people of all ages can access, in a quiet, safe space, library materials, and serve as a location engaging with learning provided by others. They can both organise their own courses and less formal support for visitors, and work with others to expand massively the range of opportunities they offer.

In short, once people have got beyond school age, libraries are often the primary place to look for lifelong learning opportunities. And of course, once again, they are best able to fulfil this role when they are connected to the internet, both as a source of information, and of course as a pre-condition for eLearning.


To conclude, the drive to ensure school connectivity is an important contribution to the goal of transforming education. Nonetheless, it does not resolve every challenge. Some – such as ensuring that we do not undervalue the role of in-person education, or of course the right to a private life – will require further reflection.

However another – how to support pre-schoolers, school-age children without the luxury of a quiet space and internet connection, and of course the adult education community – can be answered, at least in part, by ensuring that libraries are connected alongside schools.

We hope that in rolling out the GIGA initiative, the importance of connected libraries can be reflected and acted on, in support of the transformation of education.

Library Stat of the Week #44: In particular in Central and Eastern Europe, Libraries Are Well-Placed to Combat Inequality in Home Computer Access

The Internet Governance Forum has continued this week, taking place, for the first time, in virtual format. With a focus on inclusion and resilience, it has been an opportunity to emphasise the need for action to allow everyone to connect, meaningfully, to the internet.

Last week’s Library Stat of the Week started to look at the data around the numbers of households not just connected to the internet, but also who enjoy adequate speeds (broadband), and have the devices necessary to make use of it.

The data presented underlined that in a number of countries, a large share of those officially connected did not enjoy sufficient speeds or have the equipment needed – in other words, a second class type of access.

In particular, it also highlighted that these issues were more commonly experienced by those living in poorer households, compared to richer neighbours.

This week’s post looks further at these questions of inequality, and how they compare with numbers of libraries offering internet access possibilities. The data used comes from the Organisation for Economic Cooperation and Development’s data on household internet access, and IFLA’s own Library Map of the World data on public and community libraries offering internet access.

Through this, we can start to think about the potential of libraries to help people who may be at risk of having only a ‘second-class’ internet access, or none at all.

Graph 1: Public Access in Libraries and Inequalities in Household Internet Access

Graph 1 starts by looking at the number of public and community libraries per 100 000 people offering internet access, and the gap in household internet access rates between the richest and poorest 25% of the population.

Each dot represents a country, and is labelled. The further to the right the dot is, the more libraries there are offering access, while the further up it is, the higher the gap in household internet access  rates between the richest and poorest.

The Czech Republic, Hungary, Latvia and Lithuania, we can see, have both high numbers of libraries offering access, and high inequalities in household access. In general, across the countries for which data is available, where gaps are higher, there are more libraries.

This is encouraging, indicating that libraries can be well placed to address the access gaps experienced by people in less well-off households.

Graph 1: Public Access in Libraries and Inequalities in Household Broadband Access

Graph 2 repeats the exercise, but for broadband – i.e. higher speed internet that opens up different possibilities for meaningful connectivity. The picture is similar overall, although it is possible to see that in some countries, relative inequalities are greater when it comes to broadband than when it comes to basic internet access.

Graph 1: Public Access in Libraries and Inequalities in Household Computer Access

Graph 3 looks instead at household computer access. As set out last week, many uses of the internet require computers – preparing CVs, using different programmes and services, or other tools.

This shows countries in different positions relative to each other, notably with countries like Slovenia, Korea and Spain having relatively high levels of inequality when it comes to computer access related to overall incomes.

Nonetheless, the overall trend among countries still holds that in those countries where inequality in household computer access is highest, there are more libraries ready to provide an alternative.


As IFLA is arguing at the Internet Governance Forum, libraries form a vital part of the connectivity infrastructure, including the possibility of access at an adequate speed, and with the possibility to use devices that may not be available from home.

From this week’s library stat of the week, it seems clear that often in the countries that need this alternative the most, in order to avoid those on lower incomes being stuck with second-class internet, libraries are available to help.


Find out more on the Library Map of the World, where you can download key library data in order to carry out your own analysis! See our other Library Stats of the Week! We are happy to share the data that supported this analysis on request.

Library Stat of the Week #43: Not everyone counted as having internet access has the speed or device needed to use it

This week and next, the Internet Governance Forum is taking place, fittingly enough, online.

This is an opportunity to return to data about connectivity in order to provide more background on the role of libraries in helping people get the most of the internet.

The Forum itself has a strong focus on the internet as a driver of inclusion. Clearly, the most immediate way of looking at this is by counting the number of people or households which do have access.

However, simply having a connection is not always enough. When this is not fast enough (for example, where it is still a dial-up connection), or where the household does not have a computer, there is less potential to realise the full potential of the internet.

Clearly, during the pandemic, this has been a major issue, with low speeds or data caps, and a lack of (enough) computers making it more difficult for people to learn, work, or apply for support.

Libraries have long provided a valuable complement to home access, offering higher connection speeds and the necessary hardware to use the internet, even in countries which are nearing 100% connectivity officially.

To get a better idea of the numbers, we look this week at Organisation for Economic Cooperation and Development data about internet access, and in particular the differences in the shares of people counted as having internet access, and those with broadband access (i.e. higher speed internet) and computers (the devices to use it).

Graph 1: When Access Doesn't Mean Access...

Graph 1 looks at the share of households in the overall population which count as being officially connected, but which in reality lack the key conditions to use the internet – a good quality connection and a computer.

In this graph, a longer bar indicates a higher share of households in the categories set out (connected to the internet, but not with a computer, or connected but without broadband)

In the median country, about 1 in 40 households are connected but do not have a computer, although in a number of countries, this share is much higher, reaching over 1 in 5 households in Turkey, Chile and Korea.

Meanwhile, about 1 in 100 households are connected to the internet, but do not have a broadband, but this rises to around 1 in 14 in France and Brazil.


Do these numbers stand throughout the population, or does the challenge of inadequate home internet access affect some groups more than others?

To start, it’s worth reminding ourselves of the degree to which coming from a richer or poorer household affects the likelihood of having a good internet connection and a computer.

C:\Users\stephen\Downloads\LSOTW43Graph2b.pngGraph 2b: Inequalities in Internet, Broadband, Computer Access


Graphs 2a and 2b do this, showing the gaps in the share of households in the top and bottom income quartiles (i.e. the richest and poorest quarters) which have internet access, broadband, or a computer.

In these graphs, each dot represents the difference in the share of richer and of poorer households having access.

These show big gaps, in particular in computer access, with a difference of over 50 percentage points between rich and poor in Brazil, Chile, Costa Rica, Hungary, Korea, Latvia, Lithuania, Portugal and Slovenia. Iceland, the Netherlands, Norway, and Sweden tend to have the lowest inequalities here.

Graph 3: Households with Internet Access, but Without Broadband

Graph 3 repeats the analysis in Graph 1, but focusing on people with ‘slow’ connections (i.e. connected but without broadband). It breaks out the figures for poorer and richer households, in order to establish whether people in poorer households are more likely to be stuck with such ‘slow’ connections than richer people.

This does appear to be the case in almost all countries. For example, in Germany, Poland, France and Brazil, over 4% of all poorer households are stuck with slower connections. This represents 5% of all those people in poorer households classed as connected in Germany, around 10% in France and Poland, and nearly 17% in Brazil.

Graph 4: Households with Connections, but Without a Computer

Graph 4 does the same, but looking at households which are connected, but which do not have computers. It is even clearer here that richer households are less likely to find themselves in the situation of being connected, but not having a device, than poorer households.

In Korea, Chile, Costa Rica and Brazil, over 25% of poorer households are in this situation of ‘device-less connectivity’. In effect, 2/3 of poorer Korean households which are officially connected to the internet do not have devices, while the figure is around 50% in Costa Rica and Brazil, and over 1/3 in Chile.


What lessons from this for libraries? Next week, we will combine some of this data with information about libraries offering internet access. What is does indicate, already, is that there is not only a significant issue in terms of inequality in internet access, but that even where households are officially connected, we need to look hard at whether they have the speed and devices to make this meaningful.

This is of course not to mention the more human aspects – skills, confidence, support – which may also hold people back from using the internet fully as well!

As highlighted in the introduction, libraries have a role not only in providing connectivity for the unconnected, but also a solution when this home connectivity is not good enough. As this post shows, in many countries, addressing this need is a real issue.


Find out more on the Library Map of the World, where you can download key library data in order to carry out your own analysis! See our other Library Stats of the Week! We are happy to share the data that supported this analysis on request.

Library Stat of the Week #40: School children without a room of their own or an internet connection rely more on libraries than their peers

Last week’s Library Stat of the Week started to explore the data available from the Organisation for Economic Cooperation and Development’s Programme for International Student Assessment (OECD PISA) regarding libraries and inequalities.

Based on a series of questions about the type of use that students (15 year olds taking part in the test) make of libraries, and how often, the PISA 2009 database provides an index of use of libraries.

By looking how different groups, on average, score on this index (running from -1 (no use) to +1 (extreme use)), it is possible to get a sense of whether there is relatively more or less dependence on libraries, according to different characteristics. As such, this provides valuable insights into how the benefits (or pain) of investment in (or cuts to) libraries may fall.

Following on from looking at differences in library usage between 15-year olds who have a 1st or 2nd generation immigrant background, as opposed to ‘native’ students, this week looks at two indicators of disadvantage – whether children have a room of their own at home or not, and whether they have household internet access or not.

Both of these are not only signs that a student may come from a less well-off background, but can also have a direct effect on their ability to benefit from education. The possibility to read and study quietly, and to make use of all that is available on the internet, are powerful.

We start by looking at differences between students who do, and do not, have a room of their own.

Graph 1a: Difference in Library Use between Students Without, and With a Room of their Own

Graph 1b: Difference in Library Use between Students Without, and With a Room of their Own

Graphs 1a and 1b do this for each country for which data is available, giving a figure for the difference in the index of library use between students who do not, and do, have a room to themselves. A bar to the right shows that students who do not have such a private space make more use of libraries than students who do, while a bar to the left shows the contrary. The longer the bar, the bigger the difference.

Overall, it shows that in OECD countries, students who do not have a room for themselves score 0.15 points higher on average on the library usage index, while globally, the figure is 0.07. The biggest differences are to be seen in Scandinavian countries, as well as the Netherlands and Germany.

In 38 countries, students without a room of their own make more use of libraries than those who don’t. In 19 countries, it is the other way around, while in 3, there is no difference.

Graph 1c: Difference in Library Use and Average PISA Reading Scores

Graph 1c looks at whether there is much difference in this level of reliance on libraries depending on overall average reading scores. As in last week’s post, there appear to be two groups of countries – with richer countries which tend to score higher in blue, and developing countries tending to score lower in green.

Within each group, however, there is little correlation between the level of reliance on libraries by students without rooms of their own, and overall reading scores. In other words, it seems not to matter much whether a country is a high or low performer overall – those who are disadvantaged continue to make strong use of libraries.

Graphs 2a and 2b replicate the analysis in Graphs 1a and 1b, but rather comparing scores for library use between students who do not, and who do, have internet access at home.


Graph 2a: Difference in Library Use Scores between Students Without and With Home Internet Access

Graph 2b: Difference in Library Use Scores between Students Without and With Home Internet Access

The differences here are even stronger, with an OECD average difference of 0.23 and a global average of 0.17, illustrating that globally children without home internet access rely more heavily on libraries than those who don’t.

In 48 countries out of 59, libraries appear to be more important for children without home internet access than for those with it, while only in 11 do children with internet access at home make more use of libraries than those who don’t. Interestingly, the countries with the highest differences in usage are different to the ones which come top when looking at students with rooms of their own.

Graph cc: Difference in Library Use and Average PISA Reading Scores

Graph 2c then repeats the same logic as Graph 1c, looking at whether there is any reason to believe that the connection between lack of a home internet connection and library use is stronger or weaker depending on overall literacy scores.

The result – as in the case of Graph 1c – is that there is no clear connection, either in the group of lower performers or the group of higher performers. In other words, it does not matter much how well a country performs overall on literacy, library use tends to be higher among students without an internet connection at home.


The overall conclusion of this blog is that the evidence indicates that, in general, students who face barriers to benefitting from education due to their home environment tend to rely more on libraires. The corresponding argument is then that when library services are cut back, the pain will be higher for those who already have fewer resources or options.

Next week’s post will look at another dimension of inequality – the highest level of education achieved by parents.


Find out more on the Library Map of the World, where you can download key library data in order to carry out your own analysis! See our other Library Stats of the Week! We are happy to share the data that supported this analysis on request.

Library Stat of the Week #32: More can be done to close the digital access gap through public libraries

Libraries were often early adopters of digital technology, both for their own internal operations, and in support of their users.

By installing computer terminals and allowing for public access, they have given millions their first taste of the internet, in an environment where they could feel comfortable and supported in trying something new.

It is also well understood that that libraries can play a key role in bringing the unconnected online through providing this sort of public access. In some cases, this can act as a stepping stone towards private access, in others, an essential backstop for those unlikely ever to get a connection or device at home.

Frequently, those in the greatest need of this support are the poorest members of a society, who may not be able to commit to regular monthly payments, either for fixed or mobile internet. Instead, they can be stuck with pay-as-you-go options which end up more expensive.

This blog, the first in a sub-series, therefore looks at the connections between the digital access gap and the presence of libraries offering internet access. It draws on OECD statistics on internet access and usage for households and individuals, and IFLA’s own Library Map of the World.

First of all, it is worth understanding the scope of the challenge. Graph 1 indicates the differences in internet access rates (use of the internet in the past three months) between people from households in the first (poorest) and fourth (richest) quartiles of the population.

Graph 1: Internet Access Gap (Richest 25% - Poorest 25%)

In this, only three countries – Denmark, Luxembourg and Sweden have a gap of less than 10 percentage points. Meanwhile, in Hungary, the gap is almost 55 percentage points – nearly 92% of people from richer households have accessed the internet, but barely 37% of those from poorer ones.

Interestingly, only one of the nine countries with the biggest gaps does not belong to the former Eastern bloc – we will return to this point later.

Graph 2: Public/Community Libraries Offering Internet access per 100 000 people
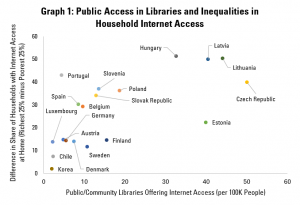
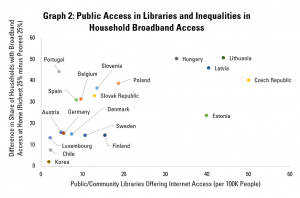
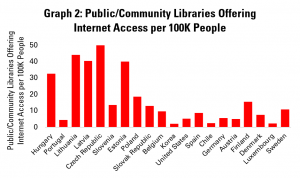
Graph 2 displays (with the same order of countries as before) the number of public and community libraries offering public internet access per 100 000 people. The Czech Republic scores highest here, with just over 50 such libraries for every 100 000 people – that’s one for every 20 000 citizens.

Lithuania and Latvia also have more than 40 public libraries offering internet access per 100 000 people, and Estonia is only a short way behind.

Again, it is noticeable that most of the countries with high numbers of libraries offering internet access are from former Eastern Bloc countries.

Graph 3: Library Internet Provision and Access Gaps
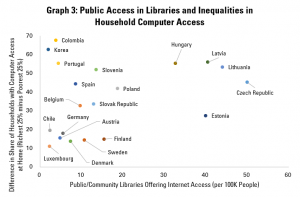
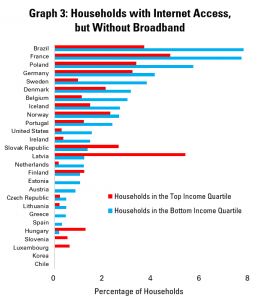
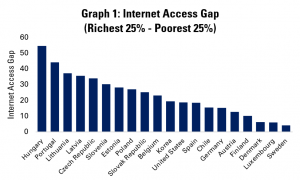
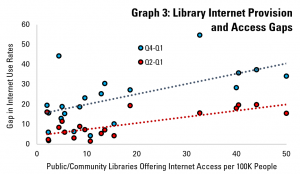
We can cross these figures in Graph 3, which aims to look at the relationship between income-related internet access gaps and the availability of libraries offering access.

This shows a correlation between the number of libraries offering access and the gap in access between rich and poor. This applies both for the difference between the richest 25% and the poorest 25% (4th quartile minus 1st quartile), but also between those roughly in the middle and those at the bottom (2nd quartile minus 1st quartile)

On the one hand, this suggests that there is – fortunately – the infrastructure in place in order to help bridge this divide. The challenge, then, is to ensure that the possibilities that libraries provide turn into smaller access gaps in reality.

Graph 4: Library internet provision and access gaps (without Central Europe)
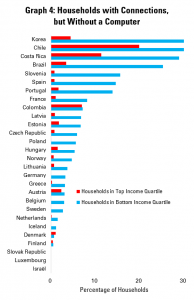
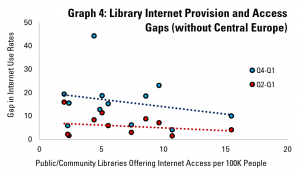
As an additional step, Graph 4 carries out the same analysis, but not including countries from the former Eastern bloc.

Here, in fact, we can see that the correlation goes in another direction, suggesting that having more libraries offering internet access tends to be associated with a smaller gap between rich and poor in terms of internet access.


The analysis presented here raises interesting questions – what more can be done to realise the potential of connected libraries to close the gap between rich and poor in terms of internet access in countries of the former Eastern bloc? Can we take the more positive correlation between equality and the existence of libraries elsewhere as a positive?

Next week, we’ll explore the same question from different angles, including age and level of education.


Find out more on the Library Map of the World, where you can download key library data in order to carry out your own analysis! See our other Library Stats of the Week! We are happy to share the data that supported this analysis on request.