Tag Archives: community libraries

Library Stat of the Week #50 (Part 2): Where there are stronger and better used public and community libraries, more people read, more often

In the final post both of this mini-series on libraries and cultural data, and of our regular Library Stat of the Week posts, we return to a core function of libraries – to promote reading and access to books.

In the past three weeks, we have looked at data around how much households spend on books, as well as on wider data around participation in artistic and cultural activities. In each case, it appears that having more libraries, and using them better, is linked to greater spending and engagement.

This week, we look at data on how people spend their time, and in particular on how many people read regularly, and then how long they spend doing it.

For many, simply encouraging more reading is an end in itself, although of course this can also have positive impacts on issues such as wellbeing (a key issue during the pandemic!), literacy (skills can deteriorate if not used) and of course on the health of the wider cultural sector.

Once again, we are drawing on data from Eurostat, and in particular the Time Spent on Cultural Activities dataset (gathered between 2008 and 2015). Given its focus, it only covers countries in Europe, but offers insights that can apply elsewhere. As ever, data on libraries comes from the IFLA Library Map of the World, crossed with World Bank population data.

To set the scene, we can look already at what we know about people’s habits around reading, in particular throughout their lives.
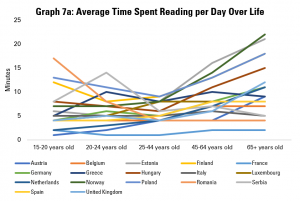
Graph 7a: Average Time Spent Reading per Day Over Life

Graph 7a does this by looking at the average time spent reading per day per person, broken down by different age groups. It shows that, in general, there is a U-shaped curve, with people reading more when they are younger and when they are older, with 25-44 year olds reading least on average.

There are exceptions within this. For example, Romanian 15-20 year olds on average read more than any others in Europe. However, older Romanians (aged 65+) are the second least regular readers. Meanwhile, young Austrians and Dutch are low readers, but their parents and grandparents on average spend a much more average amount of time reading.
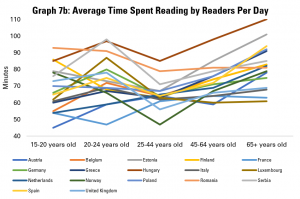
Graph 7b: Average Time Spent Reading by Readers Per Day

Graph 7b looks only at those people declaring that they do read regularly, and explores how long they spend doing this. While there is, again, a dip in average time spent reading among the 25-44 age group, this is less dramatic. Hungarian readers show up across all age groups as one of the nationalities that reads most when they do.
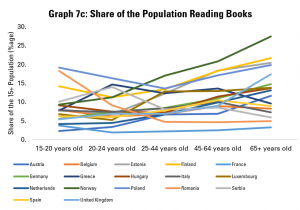
Graph 7c: Share of the Population Reading Books

The other driver of overall figures on how much people read on average is data about the share of the population reading at all. Graph 7c explores this, noting that the share of the population reading in general tends to be relatively stable, or drop between 15-20 and 25-44 year olds, and then rise relatively sharply among older groups. For example, while only an average share of younger Norwegians read, a larger share of older Norwegians than in any other country covered read. Similarly, from coming almost bottom of the class among younger groups, the older Dutch and Austrians come around average when it comes to the share of older people reading.
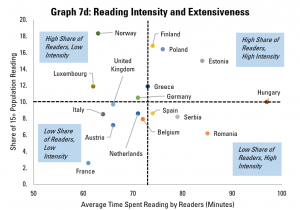
Graph 7d: Reading Intensity and Extensiveness

We can get an overview of the extensiveness (i.e. share of the overall population reading) and intensity (time spend reading by those who do) in Graph 7d, which looks at populations as a whole.

This shows us that Finland, Poland and Estonia do not just have an above average share of readers in the population, but those who do read tend to do so for longer. In contrast, Italy, France, Austria, the Netherlands, Belgium and the United Kingdom have both a below-average share of readers in the population, and those who do read do so for shorter times than average.

Finally, there is a contrast between Norway, Luxembourg and Germany (more readers, but reading for shorter times), and Spain, Serbia and Romania (fewer readers, but those who do read for longer). A separate analysis of the situation for different age groups could also be interesting here, in order to understand whether the main challenge in increasing reading is to allow more time for this, or to get more people reading in the first place.


Having looked at reading habits, it is now time to look at the relationship between libraries and reading.
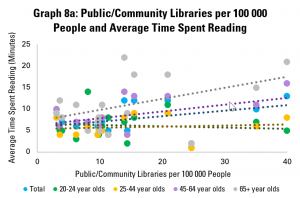
Graph 8a: Public/Community Libraries per 100 000 People and Average Time Spent Reading

Graph 8a looks at the availability of public and community libraries, as measured by the number of libraries per 100 000 people, compared to the average time spent reading by different age groups. It finds that there is a positive correlation for the population as a whole, mainly driven by older readers (those aged 45-64 and 65+). The link is less obvious for younger readers (aged 20-24 and 25-44).
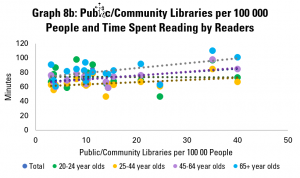
Graph 8b: Public/Community Libraries per 100 000 People and Time Spent Reading by Readers

Graph 8b looks at the amount of time spent reading by those who do read. This again shows a gentle, but positive correlation – in other words, in countries with more public and community libraries, those people who do read tend to spend more time doing so. Looking across age groups, the correlation is positive for all, although only slightly in the case of 20-24 year olds.
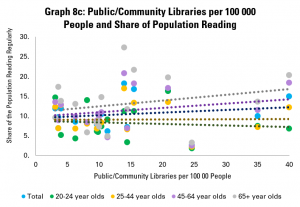
Graph 8c: Public/Community Libraries per 100 000 People and Share of Population Reading

Graph 8c looks at numbers of public and community libraries, and the share of the population in different age groups reading. Again, it finds weak but positive correlation between numbers of libraries and tendency to read, with stronger links for older groups. The picture is similar if we look only at countries with up to 20 public or community libraries per 100 000 people.

Overall, the story from this is that pure numbers of libraries are positively linked with how many people read, and how much they do, but not particularly strongly.
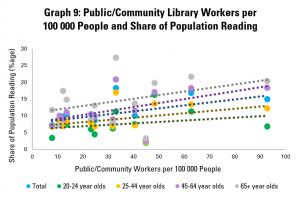
Graph 9: Public/Community Library Workers per  100 000 People and Share of Population Reading

Graph 9 goes a little further, looking rather at numbers of public and community library workers. This is, arguably, a stronger indicator of how much is being invested in the library field, as well as its ability to reach out to readers, welcome them, and support literacy.

This shows a more positive link between the strength of the library field and share of adults reading, with an increase of 10 library workers per 100 000 people tending to be linked to a rise of 1% in the share of the population reading (or 1000 people). This arguably makes sense – library staff have a key role in helping readers find books that interest them, and simply in making libraries into welcoming places.

Once again, the connection is stronger in older groups. Interestingly, it does not appear that those who do read spend more time doing so in countries with more public and community library workers.
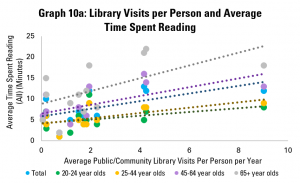
Graph 10a: Library Visits per Person and Average Time Spent Reading

Yet as in previous posts, the strength of the library field is only part of the picture – so too is how well it is used. Graph 10a does this, using data on average library visits per person per year. It shows a positive correlation between library visits and the length of time adults in general spend on reading per year, again with more positive links among older groups.
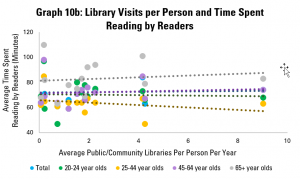
Graph 10b: Library Visits per Person and Time Spent Reading by Readers

Graph 10b looks at how long those adults who read do so on average. Here, the picture is similar to that in Graph 8b, with a weakly positive correlation. Again, it appears that there is little link between libraries and how long people spend reading.
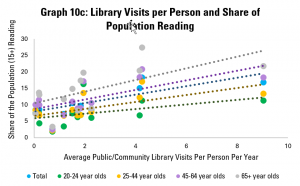
Graph 10c: Library Visits per Person and Share of Population Reading

Graph 10c however looks at the share of the adult population that reads, and once again displays a strong and positive correlation. Across the population as a whole, an increase of one library visit per person per year tends to be associated with a 1.28 percentage point rise in the share of the population reading.
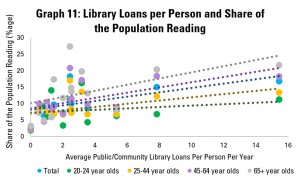
Graph 11: Library Loans per Person and Share of the Population Reading

Graph 11 repeats this last analysis, but with the average number of loans from public and community libraries per person per year. Again, there is a relatively strong positive correlation, with an extra library loan per person per year associated with a 0.6 point rise in the share of adults reading. As in Graph 10c, the connection holds for all age groups, although is stronger for older ones.


What can we conclude from this? First of all, that there are significant differences in reading habits across the European countries surveyed by Eurostat. High performance – as measured by a high average length of time spent reading per person – can be influenced by the number of people reading, and how long they read for. This performance matters, given the role of reading in maintaining and strengthening skills, in promoting wellbeing, and in providing demand for writing.

Looking at the connections with libraries, it seems that there are much stronger links between libraries and the share of the population reading than between libraries and how long people spend reading.

While correlation is not causality, the data shared here would support the argument that libraries can play a role in getting more people reading, and so in helping more people benefit in terms of skills and wellbeing. In particular, numbers of library staff appear to matter more than numbers of libraries, and levels of use of libraries have a stronger link still.

This would imply that a key focus of governments looking to boost reading will likely be to ensure that libraries are well-staffed and welcoming for all.

Throughout, the relationship between public and community libraries and numbers of people reading seems weakest in general for younger groups. To some extent, this may be because many younger people have access to university libraries (in the case of 20-24 year olds in particular), or just because of less inclination to read in general among 25-44 year olds. It can also be underlined that the importance of reading for skills is more important among older groups in any case.

Nonetheless, this does raise interesting questions about whether more can be done to increase reading among 25-44 year olds, and whether libraries can strengthen their role in this.


Find out more on the Library Map of the World, where you can download key library data in order to carry out your own analysis! See our other Library Stats of the Week! We are happy to share the data that supported this analysis on request.
Library Stat of the Week #49: Faced with Competition from Online Entertainment, Household Spending on Books Has Held Up Better Where Libraries are Stronger

In a three-part series to end our regular #LibraryStatOfTheWeek posts, we are looking at data around culture, and crossing this with information gathered by IFLA through the Library Map of the World.

Last week’s post – the first of the mini-series – therefore looked at the link between the strength of library fields (including how well used they are), and the share of household spending on culture that is dedicated to books.

This is a helpful indicator, especially in a digital age where different activities are competing for our free time and resources. Given that overall tendencies to spend on culture will be determined by a variety of external factors (earnings and disposable incomes for example), this can even be a more meaningful way of understanding the place of reading – and books – in societies.

Libraries themselves have an important role in promoting reading, both in terms of helping adults discover new works, and in ensuring that coming generations turn into capable and confident readers.

This week, we look beyond the figures for one year (2015), and rather at evolutions in spending between the two years for which data is available – 2010 and 2015. This allows us to see how well spending on books, as a share of overall household cultural spending, has fared at a time that new online cultural activities were emerging.

Once again, data on household cultural spending comes from Eurostat (and so focuses only on European countres), while data on libraries and use comes from the IFLA Library Map of the World (latest available year), crossed with population data from the World Bank in order to obtain per capita figures. In each of the analyses noted below, we have only included a country when all relevant data was available.

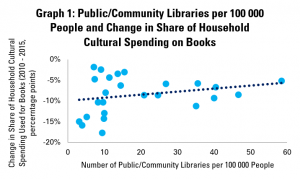
Graph 1: Public/Community Libraries per 100 000 People and Change in Share of Household Cultural Spending on Books

Graph 1 starts by comparing numbers of public and community libraries per 100 000 people with the change in the share of household cultural spending going on books between 2010 and 2015.

In the graph, each dot represents a country. The higher it is, the more positive the change in share of spending has been. The further to the right it is, the more libraries there are per 100 000 people.

It is worth noting that, in all countries covered by this data, the share of household cultural spending going on books has fallen. This makes sense, given the points set out above concerning the rise of online entertainment.

The graph indicates that, in general, countries with higher numbers of public and community libraries per 100 000 people have tended to see smaller falls in the share of cultural spending going on books.

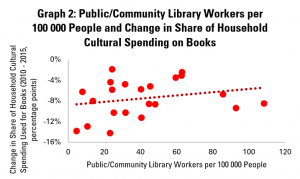
Graph 2: Public/Community Library Workers per 100 000 People and Change in Share of Household Cultural Spending on Books

Graph 2 looks rather at numbers of public and community library workers per 100 000 people. Dots further to the right on this graph therefore indicate countries with a higher number of such workers.

Here too, the story is positive – where there are more public and community library workers, in general, falls in the share of household cultural spending going on books have been lower. In other words, book sales have resisted better to competition where libraries are stronger.

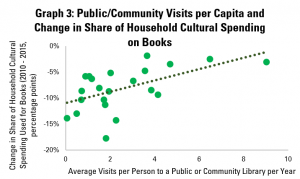
Graph 3: Public/Community Visits per Capita and Change in Share of Household Cultural Spending on Books

Graph 3 looks at numbers of visits per person to public and community libraries. This shows a relatively strong, positive correlation between library use and changes in the share of household cultural spending going on books.

This tallies with the finding last week that library visits, in particular, seem to be well-connected to the economic situation of the book sector. This makes sense – libraries can be important shop-windows, and of course also build enthusiasm for reading.

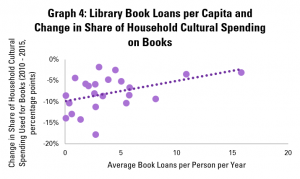
Graph 4: Library Book Loans per Capita and Change in Share of Household Cultural Spending on Books

Graph 4 looks at average numbers of book loans per capita. Again, there is a positive correlation – and indeed a stronger and more positive one than in the graph last week looking at spending in just one year.

In other words, library lending tends to be associated with better performance over time for the book sector.

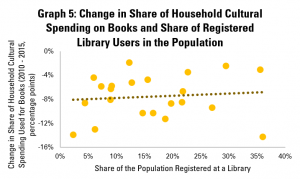
Graph 5: Change in Share of Household Cultural Spending on Books and Share of Registered Library Users in the Population

Graph 5, finally, looks at connections between numbers of registered library card holders (calculated as a share of the population), and trends in the share of books in total household cultural spending.

This again shows a positive correlation, although a less strong one, although partly driven by the result for Spain, where there is a high rate of library card holding, but also a big fall in spending on books as a share of overall cultural spending.


Overall, these figures provide further helpful support for advocacy around the value of our institutions in supporting a healthy book sector.

While correlation does not mean causality, it is possible to show that, far from greater library use being associated with lost tales, it is rather the opposite. These figures can be used in arguments to show that cuts to libraries – for example making it more difficult to visit and borrow – could be harmful to the book sector as a whole.


Find out more on the Library Map of the World, where you can download key library data in order to carry out your own analysis! See our other Library Stats of the Week! We are happy to share the data that supported this analysis on request.
Library Stat of the Week #48: In Countries with Stronger – and Better Used – Public and Community Library Fields, Books Account for Larger Shares of Household Spending on Culture

After a couple of weeks’ break, we’re back with a final mini-series of Library Stat of the Week posts, focusing this time on libraries and cultural data.

Cultural data itself is unfortunately not as widely collected as other types of data, partly because of a lack of widely adopted shared standards,  partly because – wrongly, we would suggest – it is not always a priority for statistical offices.

Fortunately, within the European Union, there is an effort to collect relevant information, looking at key questions such as how much households and governments are spending on culture, and how much people are benefitting from it.

Therefore, to close out our weekly series of library statistics posts, we are crossing data from the European Union’s Eurostat agency with data from IFLA’s Library Map of the World and the World Bank.

In this week’s post, we will look at the relationship between different public and community library indicators, and the share of total spending on cultural goods and services that goes on books.

The indicator of the share of total spending on books is useful, as it allows us to control for overall spending on culture in the population, which can vary strongly.

It also allows us to account for the fact that, arguably, different forms of culture are competing for our attention and available budgets. In other words, we can look at whether a stronger library field means that books ‘capture’ a larger share of cultural spending, a point that will be of interest, in particular to publishers and others in the book chain.

Data on spending on cultural goods and services comes from Eurostat’s database on mean expenditure by households on different goods and services. Data comes from 2015. Data on libraries comes from the Library Map of the World (most recent year), with World Bank population data (2018) used to allow us to calculate per capita figures.

As such, it is important to note that all data comes from European countries, but still allows for a look across a range of different library fields, and so can be useful for wider advocacy.

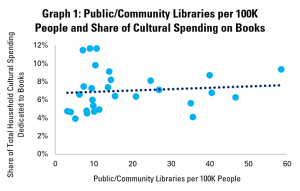
Graph 1: Public/Community Libraries per 100K People and Share of Cultural Spending on Books

Graph 1 starts by looking at shares of spending on books in total cultural spending in comparison with numbers of public and community libraries per capita.

In the graph, each point represents one country. The further to the right a point is, the more public and community libraries there are per 100 000 people, and the first up it is, the higher the share of books in overall household spending on cultural goods and services.

Looking at numbers of libraries gives an idea of how readily accessible libraries are to people, although of course does allow us to understand how well-supported each library is.

Overall, it appears then that there is a slight but small positive correlation between numbers of libraries and share of cultural spending on books.

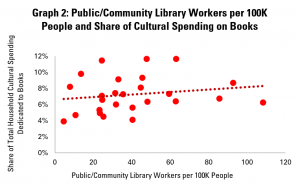
Graph 2: Public/Community Library Workers per 100K People and Share of Cultural Spending on Books

Graph 2 looks at numbers of public and community library workers (full-time equivalents), arguably a stronger indicator of the strength of library fields.

This shows a slightly stronger, slightly more positive correlation, suggesting that where there are more public and community library workers, books account for a greater share of household spending on cultural goods and spending.

However, in addition to looking at ‘inputs’ to a strong library field (i.e. number of libraries and staff), we can also look to understand how well they are used. Library Map of the World data on numbers of visits, loans and registered users can help in this regard.

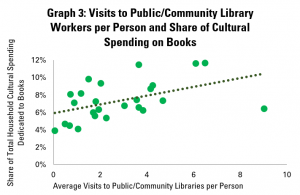
Graph 3: Visits to Public/Community Libraries per Person and Share of Cultural Spending on Books

Graph 3 therefore compares the average number of visits to public and community libraries per person per year with data on the share of household spending on cultural goods and services that goes on books.

This shows a stronger and more positive correlation still between use of libraries and spending on books. This would certainly vindicate the idea that libraries serve as venues for discovery of books, and so drive sales.

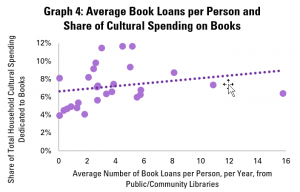
Graph 4: Average Book Loans per Person and Share of Cultural Spending on Books

Graph 4 repeats the exercise for loans of books. Once again, there is a positive correlation, although this is slightly less strong than for visits to libraries.

The fact that the connection is positive is nonetheless encouraging. Importantly, it is not negative!

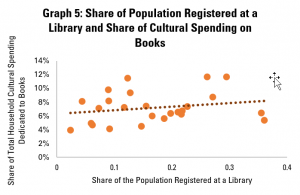
Graph 5: Share of Population Registered at a Library and Share of Cultural Spending on Books

Finally, graph 5 looks at the share of the population that is a registered library user. Once again, the correlation is positive, but slightly less strong than for the numbers of visits.

The weaker connection here could perhaps be associated with the fact that simply being registered is only a proxy for intensity of library use.


As ever, correlation does not mean causality, and so we cannot necessary say that stronger – and better used – public and community library fields mean that books account for a greater share of household cultural spending.

Nonetheless, they do show that the two often come together. In particular, the strongest connections appear to be with the most meaningful indicators of library use – visits and loans.

This data is therefore a useful reference in advocacy around libraries contributing to, rather than holding back, the economic success of the book sector.


Find out more on the Library Map of the World, where you can download key library data in order to carry out your own analysis! See our other Library Stats of the Week! We are happy to share the data that supported this analysis on request.
The IFLA-UNESCO Public Library Manifesto: Past and Future Action

This month, we are celebrating the 26th Anniversary of the IFLA-UNESCO Public Library Manifesto. Since 1994, the Manifesto has been at the heart of public library advocacy – declaring UNESCO’s belief in the public library as a living force for education, culture and information, and its essential role in the promotion of peace and well-being.

Here is a look back at how librarians around the world have used the Manifesto, and a glimpse into what is coming next for this important document.

The Manifesto at Work

Earlier in 2020, IFLA’s Public Library Section launched a global survey to gather feedback from public libraries on the Manifesto, and how they have used it in their advocacy.

With over 600 responses, this was an extremely insightful look into how libraries around the world apply the Manifesto to their work.

39% of respondents said they have actively used the Manifesto to advocate and lobby for their library.

Of those who responded in the negative, the most prevalent reason given was that they have not yet had an opportunity or were not included in relevant conversations with decision-makers.

Survey participants were asked to share examples of the Manifesto being used in their library’s advocacy or operations.

Some excellent examples include:

  • using the Manifesto to power campaigns during National Library Week
  • referring to the Manifesto in strategic materials and in lobbying
  • featuring the Manifesto in negotiations with local city council and elected officials
  • using the Manifesto as a basis to create library activities
  • guiding funding decisions and budget
  • informing the selection of books and services provided by the library

IFLA would like to help public libraries around the world better use the Public Library Manifesto in advocacy. From this survey, we have learned that increased awareness-raising about the Manifesto in the future may help empower more librarians to put it to use in their advocacy.

For more on how the Manifesto has been put into action, refer to the IFLA Research Paper: Inspire, Inform, Indicate: How the UNESCO-IFLA Public Library Manifesto Makes a Difference.

For more ideas on how the Public Library Manifesto can be used in advocacy, please see our Advocacy Pack for Libraries and Library Associations.

The Manifesto in the Future

Another key development towards increasing the impact of the Public Library Manifesto is ensuring that it remains relevant to the work of libraries today.

Therefore, UNESCO, with the help of IFLA’s Public Library Section, is planning to update the Public Library Manifesto in the coming year. The goal of this revision will be to address the ever-evolving role of public libraries in their communities, while also acknowledging the substantial technological advances that have changed how many people access, create, and consume information.

The survey also plays a major role in this work – ensuring that the voice of the global library field is considered in the review process.

Here is a look at some ideas submitted by librarians on how to improve the UNESCO Public Library Manifesto for the future.

How can the Manifesto better reflect the missions of public libraries today?

  • Emphasize the role of libraries in the information society, such as highlighting the importance of Media and Information Literacy skills.
  • Expand the definition of lifelong learning
  • Reinforce the relationship between the library and the community
  • Increase mention of the importance of inclusivity, especially relating to marginalized communities

How can the Manifesto provide better guidance to decision-makers?

  • Highlight the importance of local knowledge
  • Promote participatory decision-making, both with library professionals and with communities
  • Appeal for sufficient human and material resources, which are required for libraries to fulfil their mission.
  • Link culture to the social and economic life of the community
  • Emphasize social impacts, and the fact that they are usually seen most clearly in subsequent generations

Next Steps

These suggestions, and all the others received during the surveying process, will be taken into consideration by the Public Library Section during the drafting of the Manifesto update. This is projected to be completed in 2021.

The significance of the Public Library Manifesto is that it has codified the exceptional value that public libraries have in their communities. By working to keep it relevant, reflecting the mission of public libraries today, we can ensure it remains a powerful tool for advocacy.

Together with UNESCO, IFLA is looking forward to delivering an updated Manifesto that can continue to support public librarians the world over in their essential work.

Library Stat of the Week #27: On average, there are 4.7 volunteers for every full-time library worker

Volunteers can play an important role in helping libraries to go further in delivering on their missions. In turn, public and community libraries can be attractive places for individuals to come and offer their time.

At the same time, in some countries there is concern about over-reliance on volunteers. This can be particularly the case when staff and volunteers are seen as interchangeable by governments or other decision-makers looking to cut costs, rather than extend offers.

Both the IFLA Public and School Library Manifestos underline the importance of the presence of a librarian in order to guide services.

Clearly, understanding the respective roles of staff and volunteers depends on looking at individual libraries.

However, we can start to get an overview of the situation between countries by looking at data from the Library Map of the World.

42 countries provide information about numbers of volunteers, counted as the number of individuals who volunteer.

While these figures do not indicate how many hours they work (as opposed to data on the number of library workers, which is calculated in terms of full-time equivalents), they start to give an idea of to what extent library systems draw on volunteers to function.

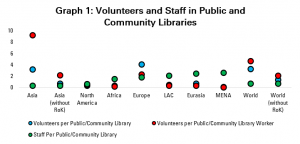
Graph 1: Volunteers and Staff in Public and Community Libraries

Graph 1 looks at the situation at the global level, and broken down across different regions.

Starting with the figures for the world as a whole (the 42 countries for which data is available, accounting for 276826 libraries and 159141 FTE staff), it appears that there is 0.67 of a full-time library worker per public or community library, but 3.3 volunteers.

In other words, there are almost 5 volunteers for every full-time staff member of a public or community library.

These figures, are, however, strongly affected by the numbers from one country – the Republic of Korea, which alone registers over 433 000 volunteers.

Once these numbers are discounted, the figures are much closer together – 0.67 FTE staff per library and 1.33 volunteers, making for just over 2 volunteers for every FTE member of staff.

Looking across the regions, it is only in Europe and Asia where the number of volunteers is higher than the number of FTE staff in public and community libraries. Of course, with only 42 countries providing data (for example, figures for North America are from Canada alone), the picture is far from complete.

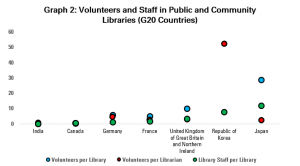
Graph 2: Volunteers and Staff in Public and Community Libraries (G20 Countries)Graph 2 presents data for those larger (G20) economies for which data is available. Among these countries, it is relatively common to have more volunteers than FTE staff, with Germany, France, the UK and Japan in this situation.

Once again, Korea is an extreme case, with data indicating that there are on average 430 volunteers per library. While there are relatively high levels of staffing per library (7.9 compared to the global average of 0.67), this still means around 50 volunteers per full time staffer.

The other countries with the highest ratio of volunteers to full-time staff are Nepal (14.3:1), Austria (10.4:1), Singapore (10.4:1), Germany (4.6:1) and the United Kingdom (3:1).


Countries and territories covered by available data are: Armenia, Austria, the Bahamas, Benin, Bhutan, Bonaire, Sint Eustatius en Saba, Bosnia and Hercegovina, Cameroon, Canada, Colombia, Costa Rica, Cyprus, Czechia, Denmark, the Dominican Republic, Egypt, Estonia, Eswatini, France, Germany, Guinea, Guyana, Hungary, India, Israel, Jamaica, Japan, Lithuania, Mongolia, Nepal, Nicaragua, Paraguay, the Republic of Korea, Saint Lucia, Singapore, Slovakia, Spain, Suriname, Thailand, Uganda, and the United Kingdom.


Find out more on the Library Map of the World, where you can download key library data in order to carry out your own analysis! See our other Library Stats of the Week! We are happy to share the data that supported this analysis on request.
Library Stat of the Week #26: Countries with more public and community librarians tend to have higher levels of social cohesion

Eric Klinenberg’s book, Palaces for the People, has popularised the idea of libraries as key parts of the ‘social infrastructure’ of the communities they serve.

This role matters, because social infrastructure supports the development of social capital – strong connections between people, often associated with trust – commonly seen as a key driver of development.

For example, when there are strong levels of trust between people, they need to spend less time protecting their own interests, and can cooperate more easily to achieve other things, such as a strong economy, inclusive social policies, or action to tackle climate change.

Trust can be built through common references and rules, often themselves developed through contacts between people. Libraries – especially public and community libraries – support both, allowing members of communities to meet and exchange in a shared space, often supported by shared resources and heritage.

Klinenberg looks at the role of libraries in building social cohesion at the level of individual cases. But what can we tell at the macro-level?

To do this, we can cross statistics from IFLA’s Library Map of the World with those from the OECD’s Society at a Glance 2016 publication. As previously in our Library Stat of the Week series, we have looked at figures both for numbers of public and community libraries and library workers.

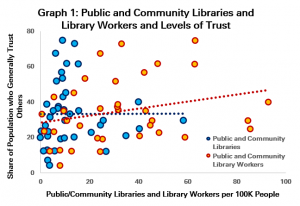
Graph 1: Public and Community Libraries and Library Workers and Levels of TrustGraph 1 compares numbers of libraries and library workers (on the horizontal X-axis) with the share of the population who felt that other people could be trusted. Each dot represents one country.

This graph indicates a positive but relatively weak correlation between numbers of library workers and levels of trust, and relatively little relationship at all between numbers of libraries and trust.

There is a positive story in here, as regards library workers of course. As we have indicated in previous posts, it is clear that the presence of librarians can play a decisive role in ensuring that libraries achieve their outcomes.

However, as concerns the number of libraries, the figure is perhaps a little disappointing. Nonetheless, from looking at the graph, it stands out that the relationship may vary as the number of libraries per 100 000 people grows.

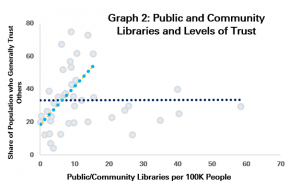
Graph 2: Public and Community Libraries and Levels of TrustGraph 2 looks further into this question, including a trend line only for countries with fewer than 20 libraries per 100 000 people (i.e. one library per 5000 people).

The difference here is striking. There is a much stronger positive correlation between numbers of libraries and trust in countries with up to 20 libraries per 100 000 people (the light blue line), but after this, the relationship becomes much flatter.

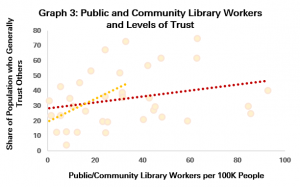
Graph 3: Public and Community Library Workers and Levels of TrustGraph 3 repeats the same process for countries with up to 40 public and community library workers per 100 000 people (the yellow line), coming to a similar conclusion. The relationship between library workers and trust is much stronger among countries below the threshold of 40 workers per 100K.

This finding is an interesting one, and would support the conclusion that in particular in countries which invest less in libraries (as measured by the number of public and community libraries and library workers), there are significant gains to be had from strengthening the field (or costs from making cuts).

Beyond a certain threshold, the gains (or costs) in terms of social cohesion are less dramatic, although as seen in previous posts, there may be impacts in other fields, such as skills or equality.

As always in this series, it is important to note that correlation is not causality. Further research would be needed to assess to what extent other factors may be in play, and it is of course also possible that societies that invest more in libraries tend to be those who believe more in supporting communal services and activities.

Nonetheless, the data here does provide a useful indicator that countries with more public and community libraries and library workers, there tends to be higher levels of social cohesion.


Find out more on the Library Map of the World, where you can download key library data in order to carry out your own analysis! See our other Library Stats of the Week! We are happy to share the data that supported this analysis on request.
Library Stat of the Week #20: Countries with more public librarians have more adults engaged in non-formal education… but there is more to do!

In last week’s Library Stat of the Week (#19), we looked at the connection between literacy skills among adults and numbers of public and community libraries and librarians, finding a correlation between numbers of librarians per 100 000 people and numbers of adults with low skills. In general, more librarians tend to mean fewer adults with low skills.

The reason for looking at these numbers is the fact that public libraries in particular traditionally have a role in facilitating literacy and learning in their communities.

This often happens in a very informal way, for example simply through independent reading or other use of library resources. However, libraries also have a role as a venue for – or portal to – more formal opportunities.

As underlined in the chapter of the 2019 Development and Access to Information report on SDG4, libraries can indeed be a vital part of countries’ infrastructure for lifelong learning.

So this week, we’ll look at the relationship between numbers of public and community libraries and the numbers of adults (aged 25-64) currently engaged in learning. Once again, we’ll use data from the Organisation for Economic Cooperation and Development (OECD) Programme for the International Assessment of Adult Competences (PIAAC). Library data comes from IFLA’s Library Map of the World.

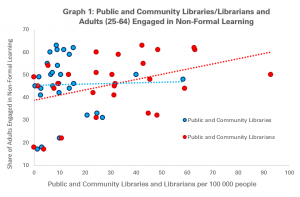
Graph 1: Public and Community Libraries/Librarians and Adults Engaged in Non-Formal Learning

The first graph looks at the relationship between the number of public and community libraries and librarians per 100 000 people and the share of the adult population in non-formal education (source). Each dot represents a country for which data is available for adult learning, and for numbers either of public and community libraries and librarians.

In a similar result to that found in last week’s Library Stat of the Week, there is correlation in the case of public and community librarians, with more librarians tending to mean more people engaged in non-formal learning. The link is less strong in the case of public and community libraries.

As with last week, this could be explained by the fact that it is the presence and support of library and information workers that helps people to make connections with learning opportunities.

The next question is to see whether there is any sign of a connection between numbers of public and community libraries and librarians, and the number of people with lower levels of education (who have not completed secondary education) involved in adult education.

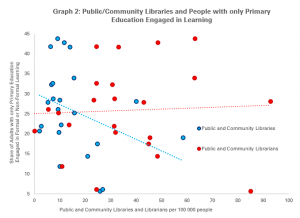
Graph 1: Public and Community Libraries/Librarians and Adults with only Primary EducationEngaged in Learning

Graph 2 does this, using figures for adults involved in all sorts of learning (formal, non-formal and a combination of the two) (source). This provides a less positive picture, with no obvious relationship between access to learning and numbers of librarians, and even a negative one with numbers of public libraries.

This suggests that governments are not yet making full use of libraries in order to help those who have not had the opportunity to reach the end of secondary education to access education. Given the evidence of what libraries can do, this is a chance missed.

Nonetheless, it is also worth bearing in mind that some countries have lower levels of adult education in learning than others in general, which helps put the number of those with only primary education in context. Other drivers of access to lifelong learning can of course be factors such as how this is paid for, or the volume and attractiveness of the offer.

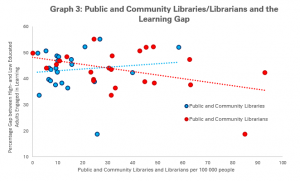
We can get an alternative perspective here by looking at the ‘learning gap’ – the difference between the share of adults with university and only primary education who are currently engaged in non-formal and/or formal education (source).

Graph 1: Public and Community Libraries/Librarians and the Learning Gap among Adult Learners with only Primary, and University Education

This in interesting as an indicator of equality, as a smaller gap means that there is a lower risk of people starting with less education falling further behind. Graph 3 shows what happens when we compare the size of this gap with numbers of public and community libraries and librarians.

Encouragingly, we see a return to the sorts of figures seen in Graph 1 and last week’s Library Stat of the Week, with larger numbers of public and community librarians per 100 000 people correlating with smaller gaps in access to learning.

While, as ever, correlation does not mean causality, one explanation here would be the role that libraries can play in ensuring that adults can have a second chance. While those who have been to university may feel more confident in looking for opportunities for opportunities for further learning, or be in jobs that welcome and support this, this may be less likely for those with only primary education. Libraries can help fill the gap.

With many – especially those in lower-skilled, lower-paid jobs – facing unemployment in the wake of the COVID-19 pandemic, governments would do well to invest both in skills provision, and the libraries that help those who need it most to find it.


Find out more on the Library Map of the World, where you can download key library data in order to carry out your own analysis! See our other Library Stats of the Week! We are happy to share the data that supported this analysis on request.