After a couple of weeks’ break, we’re back with a final mini-series of Library Stat of the Week posts, focusing this time on libraries and cultural data.
Cultural data itself is unfortunately not as widely collected as other types of data, partly because of a lack of widely adopted shared standards, partly because – wrongly, we would suggest – it is not always a priority for statistical offices.
Fortunately, within the European Union, there is an effort to collect relevant information, looking at key questions such as how much households and governments are spending on culture, and how much people are benefitting from it.
Therefore, to close out our weekly series of library statistics posts, we are crossing data from the European Union’s Eurostat agency with data from IFLA’s Library Map of the World and the World Bank.
In this week’s post, we will look at the relationship between different public and community library indicators, and the share of total spending on cultural goods and services that goes on books.
The indicator of the share of total spending on books is useful, as it allows us to control for overall spending on culture in the population, which can vary strongly.
It also allows us to account for the fact that, arguably, different forms of culture are competing for our attention and available budgets. In other words, we can look at whether a stronger library field means that books ‘capture’ a larger share of cultural spending, a point that will be of interest, in particular to publishers and others in the book chain.
Data on spending on cultural goods and services comes from Eurostat’s database on mean expenditure by households on different goods and services. Data comes from 2015. Data on libraries comes from the Library Map of the World (most recent year), with World Bank population data (2018) used to allow us to calculate per capita figures.
As such, it is important to note that all data comes from European countries, but still allows for a look across a range of different library fields, and so can be useful for wider advocacy.
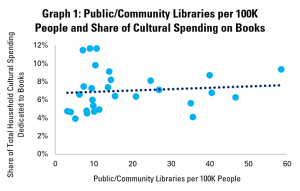
Graph 1 starts by looking at shares of spending on books in total cultural spending in comparison with numbers of public and community libraries per capita.
In the graph, each point represents one country. The further to the right a point is, the more public and community libraries there are per 100 000 people, and the first up it is, the higher the share of books in overall household spending on cultural goods and services.
Looking at numbers of libraries gives an idea of how readily accessible libraries are to people, although of course does allow us to understand how well-supported each library is.
Overall, it appears then that there is a slight but small positive correlation between numbers of libraries and share of cultural spending on books.
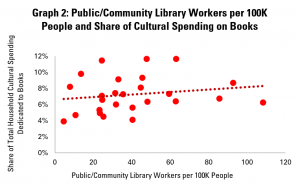
Graph 2 looks at numbers of public and community library workers (full-time equivalents), arguably a stronger indicator of the strength of library fields.
This shows a slightly stronger, slightly more positive correlation, suggesting that where there are more public and community library workers, books account for a greater share of household spending on cultural goods and spending.
However, in addition to looking at ‘inputs’ to a strong library field (i.e. number of libraries and staff), we can also look to understand how well they are used. Library Map of the World data on numbers of visits, loans and registered users can help in this regard.
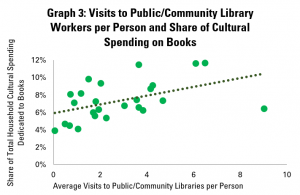
Graph 3 therefore compares the average number of visits to public and community libraries per person per year with data on the share of household spending on cultural goods and services that goes on books.
This shows a stronger and more positive correlation still between use of libraries and spending on books. This would certainly vindicate the idea that libraries serve as venues for discovery of books, and so drive sales.
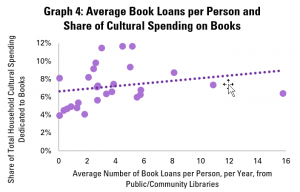
Graph 4 repeats the exercise for loans of books. Once again, there is a positive correlation, although this is slightly less strong than for visits to libraries.
The fact that the connection is positive is nonetheless encouraging. Importantly, it is not negative!
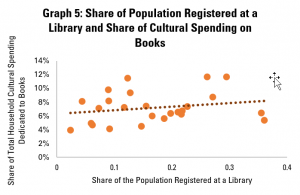
Finally, graph 5 looks at the share of the population that is a registered library user. Once again, the correlation is positive, but slightly less strong than for the numbers of visits.
The weaker connection here could perhaps be associated with the fact that simply being registered is only a proxy for intensity of library use.
As ever, correlation does not mean causality, and so we cannot necessary say that stronger – and better used – public and community library fields mean that books account for a greater share of household cultural spending.
Nonetheless, they do show that the two often come together. In particular, the strongest connections appear to be with the most meaningful indicators of library use – visits and loans.
This data is therefore a useful reference in advocacy around libraries contributing to, rather than holding back, the economic success of the book sector.
Find out more on the Library Map of the World, where you can download key library data in order to carry out your own analysis! See our other Library Stats of the Week! We are happy to share the data that supported this analysis on request.