Tag Archives: lending

Library Stat of the Week #50 (Part 2): Where there are stronger and better used public and community libraries, more people read, more often

In the final post both of this mini-series on libraries and cultural data, and of our regular Library Stat of the Week posts, we return to a core function of libraries – to promote reading and access to books.

In the past three weeks, we have looked at data around how much households spend on books, as well as on wider data around participation in artistic and cultural activities. In each case, it appears that having more libraries, and using them better, is linked to greater spending and engagement.

This week, we look at data on how people spend their time, and in particular on how many people read regularly, and then how long they spend doing it.

For many, simply encouraging more reading is an end in itself, although of course this can also have positive impacts on issues such as wellbeing (a key issue during the pandemic!), literacy (skills can deteriorate if not used) and of course on the health of the wider cultural sector.

Once again, we are drawing on data from Eurostat, and in particular the Time Spent on Cultural Activities dataset (gathered between 2008 and 2015). Given its focus, it only covers countries in Europe, but offers insights that can apply elsewhere. As ever, data on libraries comes from the IFLA Library Map of the World, crossed with World Bank population data.

To set the scene, we can look already at what we know about people’s habits around reading, in particular throughout their lives.
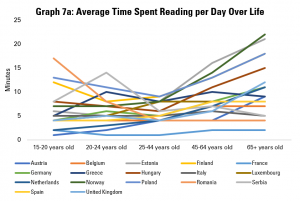
Graph 7a: Average Time Spent Reading per Day Over Life

Graph 7a does this by looking at the average time spent reading per day per person, broken down by different age groups. It shows that, in general, there is a U-shaped curve, with people reading more when they are younger and when they are older, with 25-44 year olds reading least on average.

There are exceptions within this. For example, Romanian 15-20 year olds on average read more than any others in Europe. However, older Romanians (aged 65+) are the second least regular readers. Meanwhile, young Austrians and Dutch are low readers, but their parents and grandparents on average spend a much more average amount of time reading.
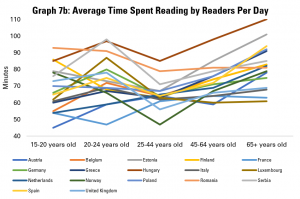
Graph 7b: Average Time Spent Reading by Readers Per Day

Graph 7b looks only at those people declaring that they do read regularly, and explores how long they spend doing this. While there is, again, a dip in average time spent reading among the 25-44 age group, this is less dramatic. Hungarian readers show up across all age groups as one of the nationalities that reads most when they do.
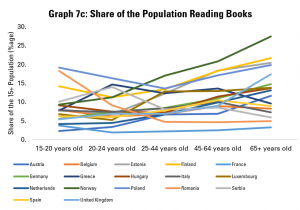
Graph 7c: Share of the Population Reading Books

The other driver of overall figures on how much people read on average is data about the share of the population reading at all. Graph 7c explores this, noting that the share of the population reading in general tends to be relatively stable, or drop between 15-20 and 25-44 year olds, and then rise relatively sharply among older groups. For example, while only an average share of younger Norwegians read, a larger share of older Norwegians than in any other country covered read. Similarly, from coming almost bottom of the class among younger groups, the older Dutch and Austrians come around average when it comes to the share of older people reading.
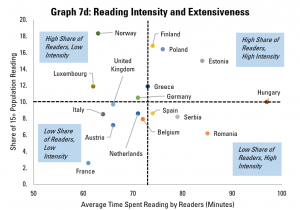
Graph 7d: Reading Intensity and Extensiveness

We can get an overview of the extensiveness (i.e. share of the overall population reading) and intensity (time spend reading by those who do) in Graph 7d, which looks at populations as a whole.

This shows us that Finland, Poland and Estonia do not just have an above average share of readers in the population, but those who do read tend to do so for longer. In contrast, Italy, France, Austria, the Netherlands, Belgium and the United Kingdom have both a below-average share of readers in the population, and those who do read do so for shorter times than average.

Finally, there is a contrast between Norway, Luxembourg and Germany (more readers, but reading for shorter times), and Spain, Serbia and Romania (fewer readers, but those who do read for longer). A separate analysis of the situation for different age groups could also be interesting here, in order to understand whether the main challenge in increasing reading is to allow more time for this, or to get more people reading in the first place.


Having looked at reading habits, it is now time to look at the relationship between libraries and reading.
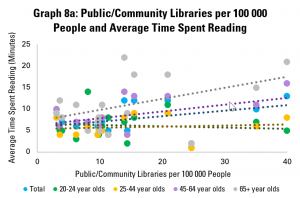
Graph 8a: Public/Community Libraries per 100 000 People and Average Time Spent Reading

Graph 8a looks at the availability of public and community libraries, as measured by the number of libraries per 100 000 people, compared to the average time spent reading by different age groups. It finds that there is a positive correlation for the population as a whole, mainly driven by older readers (those aged 45-64 and 65+). The link is less obvious for younger readers (aged 20-24 and 25-44).
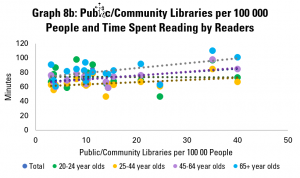
Graph 8b: Public/Community Libraries per 100 000 People and Time Spent Reading by Readers

Graph 8b looks at the amount of time spent reading by those who do read. This again shows a gentle, but positive correlation – in other words, in countries with more public and community libraries, those people who do read tend to spend more time doing so. Looking across age groups, the correlation is positive for all, although only slightly in the case of 20-24 year olds.
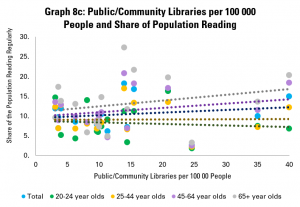
Graph 8c: Public/Community Libraries per 100 000 People and Share of Population Reading

Graph 8c looks at numbers of public and community libraries, and the share of the population in different age groups reading. Again, it finds weak but positive correlation between numbers of libraries and tendency to read, with stronger links for older groups. The picture is similar if we look only at countries with up to 20 public or community libraries per 100 000 people.

Overall, the story from this is that pure numbers of libraries are positively linked with how many people read, and how much they do, but not particularly strongly.
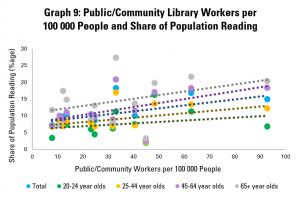
Graph 9: Public/Community Library Workers per  100 000 People and Share of Population Reading

Graph 9 goes a little further, looking rather at numbers of public and community library workers. This is, arguably, a stronger indicator of how much is being invested in the library field, as well as its ability to reach out to readers, welcome them, and support literacy.

This shows a more positive link between the strength of the library field and share of adults reading, with an increase of 10 library workers per 100 000 people tending to be linked to a rise of 1% in the share of the population reading (or 1000 people). This arguably makes sense – library staff have a key role in helping readers find books that interest them, and simply in making libraries into welcoming places.

Once again, the connection is stronger in older groups. Interestingly, it does not appear that those who do read spend more time doing so in countries with more public and community library workers.
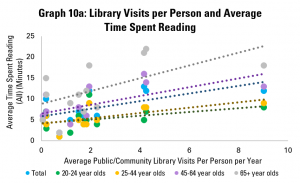
Graph 10a: Library Visits per Person and Average Time Spent Reading

Yet as in previous posts, the strength of the library field is only part of the picture – so too is how well it is used. Graph 10a does this, using data on average library visits per person per year. It shows a positive correlation between library visits and the length of time adults in general spend on reading per year, again with more positive links among older groups.
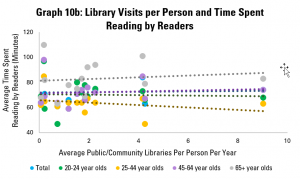
Graph 10b: Library Visits per Person and Time Spent Reading by Readers

Graph 10b looks at how long those adults who read do so on average. Here, the picture is similar to that in Graph 8b, with a weakly positive correlation. Again, it appears that there is little link between libraries and how long people spend reading.
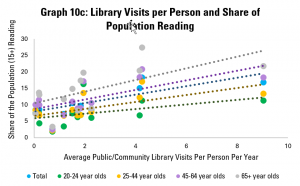
Graph 10c: Library Visits per Person and Share of Population Reading

Graph 10c however looks at the share of the adult population that reads, and once again displays a strong and positive correlation. Across the population as a whole, an increase of one library visit per person per year tends to be associated with a 1.28 percentage point rise in the share of the population reading.
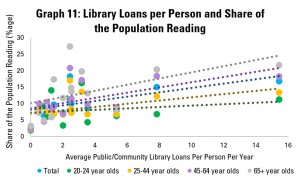
Graph 11: Library Loans per Person and Share of the Population Reading

Graph 11 repeats this last analysis, but with the average number of loans from public and community libraries per person per year. Again, there is a relatively strong positive correlation, with an extra library loan per person per year associated with a 0.6 point rise in the share of adults reading. As in Graph 10c, the connection holds for all age groups, although is stronger for older ones.


What can we conclude from this? First of all, that there are significant differences in reading habits across the European countries surveyed by Eurostat. High performance – as measured by a high average length of time spent reading per person – can be influenced by the number of people reading, and how long they read for. This performance matters, given the role of reading in maintaining and strengthening skills, in promoting wellbeing, and in providing demand for writing.

Looking at the connections with libraries, it seems that there are much stronger links between libraries and the share of the population reading than between libraries and how long people spend reading.

While correlation is not causality, the data shared here would support the argument that libraries can play a role in getting more people reading, and so in helping more people benefit in terms of skills and wellbeing. In particular, numbers of library staff appear to matter more than numbers of libraries, and levels of use of libraries have a stronger link still.

This would imply that a key focus of governments looking to boost reading will likely be to ensure that libraries are well-staffed and welcoming for all.

Throughout, the relationship between public and community libraries and numbers of people reading seems weakest in general for younger groups. To some extent, this may be because many younger people have access to university libraries (in the case of 20-24 year olds in particular), or just because of less inclination to read in general among 25-44 year olds. It can also be underlined that the importance of reading for skills is more important among older groups in any case.

Nonetheless, this does raise interesting questions about whether more can be done to increase reading among 25-44 year olds, and whether libraries can strengthen their role in this.


Find out more on the Library Map of the World, where you can download key library data in order to carry out your own analysis! See our other Library Stats of the Week! We are happy to share the data that supported this analysis on request.
Library Stat of the Week #49: Faced with Competition from Online Entertainment, Household Spending on Books Has Held Up Better Where Libraries are Stronger

In a three-part series to end our regular #LibraryStatOfTheWeek posts, we are looking at data around culture, and crossing this with information gathered by IFLA through the Library Map of the World.

Last week’s post – the first of the mini-series – therefore looked at the link between the strength of library fields (including how well used they are), and the share of household spending on culture that is dedicated to books.

This is a helpful indicator, especially in a digital age where different activities are competing for our free time and resources. Given that overall tendencies to spend on culture will be determined by a variety of external factors (earnings and disposable incomes for example), this can even be a more meaningful way of understanding the place of reading – and books – in societies.

Libraries themselves have an important role in promoting reading, both in terms of helping adults discover new works, and in ensuring that coming generations turn into capable and confident readers.

This week, we look beyond the figures for one year (2015), and rather at evolutions in spending between the two years for which data is available – 2010 and 2015. This allows us to see how well spending on books, as a share of overall household cultural spending, has fared at a time that new online cultural activities were emerging.

Once again, data on household cultural spending comes from Eurostat (and so focuses only on European countres), while data on libraries and use comes from the IFLA Library Map of the World (latest available year), crossed with population data from the World Bank in order to obtain per capita figures. In each of the analyses noted below, we have only included a country when all relevant data was available.

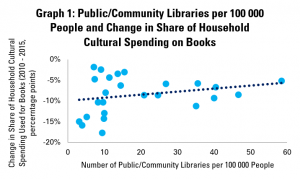
Graph 1: Public/Community Libraries per 100 000 People and Change in Share of Household Cultural Spending on Books

Graph 1 starts by comparing numbers of public and community libraries per 100 000 people with the change in the share of household cultural spending going on books between 2010 and 2015.

In the graph, each dot represents a country. The higher it is, the more positive the change in share of spending has been. The further to the right it is, the more libraries there are per 100 000 people.

It is worth noting that, in all countries covered by this data, the share of household cultural spending going on books has fallen. This makes sense, given the points set out above concerning the rise of online entertainment.

The graph indicates that, in general, countries with higher numbers of public and community libraries per 100 000 people have tended to see smaller falls in the share of cultural spending going on books.

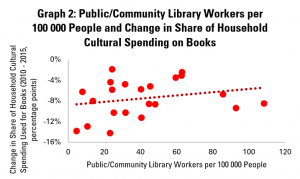
Graph 2: Public/Community Library Workers per 100 000 People and Change in Share of Household Cultural Spending on Books

Graph 2 looks rather at numbers of public and community library workers per 100 000 people. Dots further to the right on this graph therefore indicate countries with a higher number of such workers.

Here too, the story is positive – where there are more public and community library workers, in general, falls in the share of household cultural spending going on books have been lower. In other words, book sales have resisted better to competition where libraries are stronger.

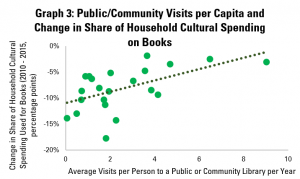
Graph 3: Public/Community Visits per Capita and Change in Share of Household Cultural Spending on Books

Graph 3 looks at numbers of visits per person to public and community libraries. This shows a relatively strong, positive correlation between library use and changes in the share of household cultural spending going on books.

This tallies with the finding last week that library visits, in particular, seem to be well-connected to the economic situation of the book sector. This makes sense – libraries can be important shop-windows, and of course also build enthusiasm for reading.

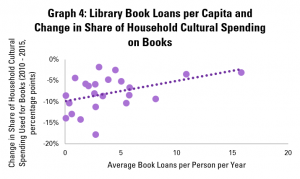
Graph 4: Library Book Loans per Capita and Change in Share of Household Cultural Spending on Books

Graph 4 looks at average numbers of book loans per capita. Again, there is a positive correlation – and indeed a stronger and more positive one than in the graph last week looking at spending in just one year.

In other words, library lending tends to be associated with better performance over time for the book sector.

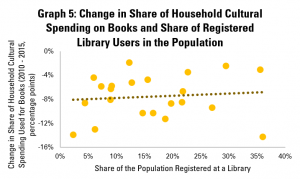
Graph 5: Change in Share of Household Cultural Spending on Books and Share of Registered Library Users in the Population

Graph 5, finally, looks at connections between numbers of registered library card holders (calculated as a share of the population), and trends in the share of books in total household cultural spending.

This again shows a positive correlation, although a less strong one, although partly driven by the result for Spain, where there is a high rate of library card holding, but also a big fall in spending on books as a share of overall cultural spending.


Overall, these figures provide further helpful support for advocacy around the value of our institutions in supporting a healthy book sector.

While correlation does not mean causality, it is possible to show that, far from greater library use being associated with lost tales, it is rather the opposite. These figures can be used in arguments to show that cuts to libraries – for example making it more difficult to visit and borrow – could be harmful to the book sector as a whole.


Find out more on the Library Map of the World, where you can download key library data in order to carry out your own analysis! See our other Library Stats of the Week! We are happy to share the data that supported this analysis on request.

Library Stat of the Week #48: In Countries with Stronger – and Better Used – Public and Community Library Fields, Books Account for Larger Shares of Household Spending on Culture

After a couple of weeks’ break, we’re back with a final mini-series of Library Stat of the Week posts, focusing this time on libraries and cultural data.

Cultural data itself is unfortunately not as widely collected as other types of data, partly because of a lack of widely adopted shared standards,  partly because – wrongly, we would suggest – it is not always a priority for statistical offices.

Fortunately, within the European Union, there is an effort to collect relevant information, looking at key questions such as how much households and governments are spending on culture, and how much people are benefitting from it.

Therefore, to close out our weekly series of library statistics posts, we are crossing data from the European Union’s Eurostat agency with data from IFLA’s Library Map of the World and the World Bank.

In this week’s post, we will look at the relationship between different public and community library indicators, and the share of total spending on cultural goods and services that goes on books.

The indicator of the share of total spending on books is useful, as it allows us to control for overall spending on culture in the population, which can vary strongly.

It also allows us to account for the fact that, arguably, different forms of culture are competing for our attention and available budgets. In other words, we can look at whether a stronger library field means that books ‘capture’ a larger share of cultural spending, a point that will be of interest, in particular to publishers and others in the book chain.

Data on spending on cultural goods and services comes from Eurostat’s database on mean expenditure by households on different goods and services. Data comes from 2015. Data on libraries comes from the Library Map of the World (most recent year), with World Bank population data (2018) used to allow us to calculate per capita figures.

As such, it is important to note that all data comes from European countries, but still allows for a look across a range of different library fields, and so can be useful for wider advocacy.

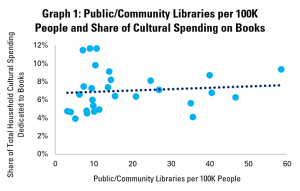
Graph 1: Public/Community Libraries per 100K People and Share of Cultural Spending on Books

Graph 1 starts by looking at shares of spending on books in total cultural spending in comparison with numbers of public and community libraries per capita.

In the graph, each point represents one country. The further to the right a point is, the more public and community libraries there are per 100 000 people, and the first up it is, the higher the share of books in overall household spending on cultural goods and services.

Looking at numbers of libraries gives an idea of how readily accessible libraries are to people, although of course does allow us to understand how well-supported each library is.

Overall, it appears then that there is a slight but small positive correlation between numbers of libraries and share of cultural spending on books.

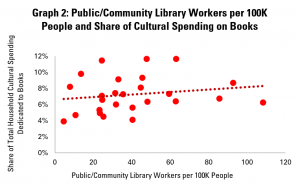
Graph 2: Public/Community Library Workers per 100K People and Share of Cultural Spending on Books

Graph 2 looks at numbers of public and community library workers (full-time equivalents), arguably a stronger indicator of the strength of library fields.

This shows a slightly stronger, slightly more positive correlation, suggesting that where there are more public and community library workers, books account for a greater share of household spending on cultural goods and spending.

However, in addition to looking at ‘inputs’ to a strong library field (i.e. number of libraries and staff), we can also look to understand how well they are used. Library Map of the World data on numbers of visits, loans and registered users can help in this regard.

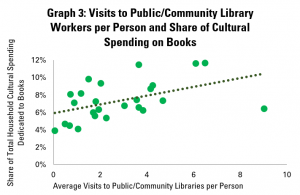
Graph 3: Visits to Public/Community Libraries per Person and Share of Cultural Spending on Books

Graph 3 therefore compares the average number of visits to public and community libraries per person per year with data on the share of household spending on cultural goods and services that goes on books.

This shows a stronger and more positive correlation still between use of libraries and spending on books. This would certainly vindicate the idea that libraries serve as venues for discovery of books, and so drive sales.

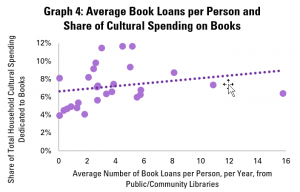
Graph 4: Average Book Loans per Person and Share of Cultural Spending on Books

Graph 4 repeats the exercise for loans of books. Once again, there is a positive correlation, although this is slightly less strong than for visits to libraries.

The fact that the connection is positive is nonetheless encouraging. Importantly, it is not negative!

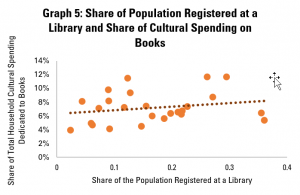
Graph 5: Share of Population Registered at a Library and Share of Cultural Spending on Books

Finally, graph 5 looks at the share of the population that is a registered library user. Once again, the correlation is positive, but slightly less strong than for the numbers of visits.

The weaker connection here could perhaps be associated with the fact that simply being registered is only a proxy for intensity of library use.


As ever, correlation does not mean causality, and so we cannot necessary say that stronger – and better used – public and community library fields mean that books account for a greater share of household cultural spending.

Nonetheless, they do show that the two often come together. In particular, the strongest connections appear to be with the most meaningful indicators of library use – visits and loans.

This data is therefore a useful reference in advocacy around libraries contributing to, rather than holding back, the economic success of the book sector.


Find out more on the Library Map of the World, where you can download key library data in order to carry out your own analysis! See our other Library Stats of the Week! We are happy to share the data that supported this analysis on request.

Library Stat of the Week #14: Four out of five loans at the median national library are in electronic format

In the last two library stats of the week, we have looked at the relationship between digital and physical loans from public and academic libraries.

Based on countries for which data is available, it is clear that there is a big difference in use of eBooks and other electronic formats. In public libraries, loans of electronic books and documents represents less than 14% of all loans, while in academic libraries, the figure is more than 94%.

What about national libraries?

Often the biggest library in the country, they hold very significant collections, thanks both to legal deposit (where this is in place) and proactive collection policies. As such, they are a critical resource for researchers, educators, and all others simply with an interest in culture and history. Some are even explicitly combined with public or university library functions.

The resources they hold can be subject to particular rules, especially legal deposit copies of works. In some countries, for example, it may be possible to send physical copies of works but not digital ones. In others, there is digital access, but only in specific places.

Clearly, at a time of COVID-19, where digital tools provide the only means of accessing content, there is a need for laws and practices that allow this. In general, of course, more digital access to national library collections contributes to their mission to facilitate research, education and access to culture, without people having to travel.

So what was the situation before the crisis? IFLA’s Library Map of the World offers insights into this, with almost forty countries sharing data on how many books, eBooks, documents and downloads they offer.

Overall, it is clear that many national libraries have already seized the possibilities that digital is offering. Across countries for which data is available, the median share of digital loans and downloads in total loans was just under 80% – this was the case in Malaysia.

This means that almost four times as many books and documents were being shared electronically than physically. In 13 of the 38 countries, national libraries were sharing over ten times as many works in digital form than in physical. Nonetheless, in fifteen the share of digital books and documents in the total was less than 50%.

To some extent, as set out above, differences between national libraries may be down to the rules they face and the nature of their collections. What is certain is that in current circumstances, there is a real value in finding ways to facilitate access to the works that they hold.


Find out more on the Library Map of the World, where you can download key library data in order to carry out your own analysis! See our other Library Stats of the Week! We are happy to share the data that supported this analysis on request.

7 out of 10: the ARIPO Model Copyright Law

The African Regional Intellectual Property Organisation (ARIPO) has released its model copyright law.

ARIPO it aims to support the work of intellectual property (IP) teams across Africa, through both country-specific capacity building, and regional-level reports and guidance.

Its 19 Member States come primarily from English-speaking Africa (with some exceptions), and will now doubtless be encouraged to refer to the Model Law in reflecting on their own reforms.

This means that the document has a potentially powerful impact. As such, it is worth being clear about its strengths, weaknesses, and silences, from a library point of view. Library associations and others advocating for better laws for libraries should be aware of where the Model Law will, or will not help.

This blog therefore explores the positives, the negatives, and the holes in the Model Law. All references to Articles are to the Model Law, unless stated otherwise).


The Good

Fair Dealing: in the first Article of the chapter on exceptions and limitations (Article 18), the Model Law suggests that uses which constitute fair dealing, for the purposes of scientific research, private use, criticism or review, or the reporting of current events should be permissible (Article 18(1)). It then offers a set of criteria for judging the fairness of this dealing – the purpose and character of the use, the nature of the protected work (how original is it?), the amount of the work used, and the effect of the use on the market (Article 18(3)).

This is a positive step, giving valuable flexibility to libraries and other users in making reasonable uses of works. However, it if course remains less open than fair use exceptions, which do not have closed list of accepted purposes. If the list was to be made open (for example by adding a ‘such as’ before the list of purposes), it would offer an even better model.

Inclusion of Unpublished Works: too often, copyright exceptions only apply to works which have been formally published. This can make the work of libraries and archives in dealing with unpublished works more complicated. The Model Law underlines that the fact of being unpublished does not prevent uses under fair dealing (Article 18(4)).

A Digitally-Reading Education Exception: the Model Law makes it clear that it is possible to make uses of copyrighted works for education purposes via electronic networks, and not just in analogue form (Article 21(1)(a) and 21(1)(b)).

Interestingly, the only area where the exception can be cancelled out by a licence is for in-person teaching (Article 21(1)(c)(iii)). This is clearly not ideal, given that the Article is, anyway, covered by the rule that uses under exceptions should not conflict with the normal market exploitation of a work.

A Technologically Neutral Definition of Copying: too often, national laws suggest that copies can only be made through a specific technology, such as photocopying. The Model Law has the merit of underlining that it is possible to make reproductions through any format (Article 2).

Protection of the Public Domain: the Model Law includes standard provisions on facts, data, news and political speeches not being protected by copyright, but is clear that this also applies to laws, court judgements and other administrative texts are also in the public (Article 6). Furthermore, there is an explicit definition of the public domain, which allows the possibility for authors to renounce their rights. This is positive, given the tendency in some countries to create unwaivable rights which undermine initiatives such as Creative Commons (Article 35).

No Term Extension: the Model Law does not take the opportunity too often used elsewhere (and in spite of the evidence) to go beyond protection lasting for the lifetime of the author plus fifty years. This is a useful model to use elsewhere.

Inclusion of Museums: the provisions on library copying also apply to archives and museums. This is a positive, given the challenges identified in WIPO work around museums facing different conditions and rules to other heritage institutions.


The Bad

Overall, the Model Law provides a relatively good example for governments. However, there are some weaknesses which libraries should look to avoid replicating in their own national legislation. The below suggestions are in addition to the encouragement to adopt fair use above.

Vague Provisions on Circumventing Technological Protection Measures: in line with the WIPO Copyright Treaty, the Model Law underlines that ‘effective’ technological protection measures should themselves be protected by law. In other countries, there then follows a guarantee that users should be still be allowed to carry out permitted acts (i.e. under exceptions). However, the ARIPO Model Law only provides that governments may make exceptions. This is far too weak at a time that libraries are acquiring a growing share of collections in digital form (Article 40(4) ad 45(3)).

No Lending Exception: the Model Law includes public lending as one of the uses over which a rightholder should have exclusive rights. This is not something required by the Berne Convention itself (which only covers rental). This risks obliging libraries to make payments or seek authorisation for lending (over and above what they have paid to acquire books in the first place). This risks seriously damaging libraries’ ability to promote literacy and a love of books (Article 7(1)(k).

Restrictions on Preservation Copying: while the Model Law does (commendably) not limit the technology used to make copies, the fact that it only talks about ‘a’ copy poses to digitisation efforts (Article 23(3)). In line with recent EU reforms, it would be better to talk about taking copies in the quantity necessary to achieve the goal.

Furthermore, the Model Law also includes the obligation to see if a commercially available copy is available before taking such a copy. This risks introducing an unhelpful administrative burden, and may not be practicable. Given that it is usually cheaper to buy a copy than digitise and preserve, it would be better to leave the choice between copying and buying to libraries, rather than enforcing it through law (also Article 23(3)).

Imposing Commercial Availability Checks for Marrakesh Copying: The Marrakesh Treaty made an important breakthrough by removing copyright-related barriers to making and sharing accessible format copies of books for people with print disabilities. It did however leave the possibility for Member States to impose restrictions though, in the form of an optional remuneration requirement, or the obligation to check if an accessible format copy is not already available on the market before making or sharing one (Marrakesh Treaty, Articles 4(4) and 4(5)).

Libraries have argued strongly against making use of either of these possibilities, given the financial and administrative cost. However, the Model Law does suggest that there should be a check on commercial availability. Given the lack of information about which books are available where, and in what formats, such a requirement risks only leading to uncertainty.

Lack of Provisions on Collective Management: the Model Law is surprisingly thin on guidance about the regulation of collective management organisations (Article 57), while at the same time including provisions on extended collective licencing (Article 38). While it is clear that well-managed collecting societies can facilitate the work of libraries when carrying out uses that fall outside of exceptions, it is essential that these are run in a transparent and accountable way in order to be legitimate.

The Model Law says very little about the need for CMOs to be independent of government (in order to avoid conflicts of interest in the operation of copyright offices), to publish information about how much they are collecting and paying out, or to be representative of rightholders and rights when offering licences. At a time when multiple governments are needing to act to force better governance in this field, the vagueness of the Model Law is troubling.

Over-Application of the Three-Step Text: The Berne Convention only applies the three-step test (that a use needs to be a certain specific case, not conflict with the normal market exploitation of a work, and not unreasonably prejudice the legitimate rights of rightholders) only to exceptions to the reproduction right (Article 9(2), Berne Convention). However, the Model Law applies this to all exceptions, leading to potentially unhelpful debates about what is and is not possible (Article 18(2))

Attribution Obligations: on various occasions (Articles 18(1), 21(2), 22, 23(2), 24(1), 26(3)), the Model Law suggests that use can only be made under exceptions if there is attribution. However, this may not always be possible. Laws elsewhere recognise this possibility to make uses without attribution when this is not practicable. However, the Model Law does not, creating uncertainty for users who do not know the author of the work they are using.

Licence Override for Document Supply: as mentioned above, the exception allowing for educational uses of works in face-to-face teaching can be disapplied when a licence is available. This also applies to situations when libraries are making copies for the private use of users. Where a collective management organisation argues that it can offer licences, this could do a lot of damage to document supply activities (Article 23(2)(a)(iii).

Block on Parallel Importation: in the context of WIPO, libraries have argued that even when there is a domestic rightholder with the right to distribute a work nationally, it should be possible for libraries to make acquisitions across borders. This can be essential in order to meet requests for specific versions of works, or, for example, when the domestic rightholder is not active. The Model Law gives the rightholder the exclusive right to import works, without exceptions (Article 7(1)(j)).

Limits on Caricature, Pastiche and Parody: the Model Law does include welcome exceptions to economic rights (such as reproduction) for review and critic. However, the exception for caricature, pastiche and parody (Article 30) only applies to moral rights, and not to economic rights. As such, it may make it possible to restrict such activities on other grounds.


The Missing

The Model Law, while comprehensive, does not cover a number of areas which, from a library point of view, would be desirable in any national copyright law.

Orphan and Out-of-Commerce Works: libraries hold many works which are no longer commercially available, but are still in copyright. As such, there are significant restrictions on how far they can give access. This is particularly difficult when a work is orphaned (i.e. it isn’t possible to identify or local rightholders). More and more countries are introducing provisions allowing libraries to permit use of such works, subject to various conditions. The Model Law does not even reference these issues.

Text and Data Mining: legal uncertainty about the possibility for libraries to allow for text and data mining of works in their collections has lead a number of countries to introduce explicit exceptions. There is nothing about this in the ARIPO Model Law, meaning that there is continued uncertainty.

Limited Exceptions for People with Disabilities: while the Model Law does copy provisions from the Marrakesh Treaty for people with print disabilities, it does not take the opportunity (foreseen in the Marrakesh Treaty) to apply similar rules for people with other disabilities (such as sub-titling for people experiencing deafness). Many countries do allow copying without restrictions on the type of disability – it is a shame that this possibility has not been included in the Model Law.

Contract Override: the Model Law is silent on the issue of contract override – i.e. the possibility for exceptions and limitations to be cancelled out by the terms of a licence. In a growing number of countries, there are conscious steps to prevent this from happening, and so defend user rights. National governments should introduce broad provisions ensuring the pre-emption of any contract terms which do undermine exceptions.

Cross-Border: the Model Law only refers to cross-border uses in the case of the provisions on sharing accessible format copies of works for people with print disabilities. There is nothing anywhere else which would allow for the cross-border application of exceptions.

This is perhaps an unfair criticism of course – it is only through international law making that there can be legal certainty for cross-border uses. ARIPO itself could act, but the most effective solution would need to come from WIPO itself. IFLA of course continues to engage to achieve this.


Conclusion

Overall, the ARIPO Model Law does cover a number of key points which help libraries do their job, in particular relatively flexible fair dealing provisions. However, there remain a number of flaws, both specifically (lending rights, limitations on preservation), and cross-cutting ones (contract override).

Governments should therefore not look to adopt the Model Law wholesale, but rather work with their library associations to ensure that they have rules that truly support the public interest missions of libraries. Overall, the Model Laws gets a 7 out of 10.

Fail! How Copyright Risks Creating Market Failures, and How Exceptions Can Correct Them

At the end of a recent WIPO meeting, a suggestion was made that the Marrakesh Treaty – which removes the need to seek permission in order to make or share accessible format copies of books – was a response to a market failure.

Market failures happen when the impacts of a decision (to do something or not) are not fully taken into account by the person making it. These impacts are known as ‘externalities’.

Examples include pollution (which mainly affects people other than the ones responsible), or street lighting (which benefits everyone who passes by, regardless of whether they have paid taxes for it). These are ‘negative’ and ‘positive’ externalities respectively.

When there are externalities, a producer will make more, or less, of something than is optimal for society as a whole.

Talking about the Marrakesh Treaty as a market failure raises some interesting questions about the way copyright works.

All forms of intellectual property are, arguably, a response to another market failure. Traditionally, in the case of copyright, if an author and publisher have invested money in order to produce a book, but then anyone can copy and sell it for less, there is an externality.

The original author is not able to benefit from all of the positives associated with the book, and so may not produce again.

Copyright – under the ‘orthodox’ model of revenue generation that dominates today – helps correct this by giving exclusive rights to the author or their publisher.

However, as in the case of the Marrakesh Treaty, it is clear that the rights given by copyright can create their own problems. In effect, by leaving almost all decisions about who can do what, with what, in the hands of the rightholder, it places them in the same position as the producer mentioned above.

While Marrakesh did deal with a specific population – albeit one numbering into the hundreds of millions around the world – this is not to say that market failures do not exist elsewhere. This blog looks at four areas where they may appear and affect the work of libraries, and underlines how exceptions to copyright can offer a response.


Market Failures Linked to Types of User

This was very much the case with the Marrakesh Treaty, where the limited buying power of people with print disabilities in many parts of the world made them less interesting as a market.

This is not because there was not a value to people with print disabilities from gaining access. Indeed, for them, the possibility to read and enjoy works can lead not only to greater well-being, but also to new opportunities.

The same can be said for children and young families for example. Children can have a huge appetite for books, and most parents are unable to pay for all of the books they will read.

Publishers, however, cannot lower prices for individuals or groups without this threatening their profitability. We risk a situation of many children being left with only limited access to books – including arguably those who need it most.

The possibility to borrow books from the library not only ensures demand is met today, without costing sales, but also helps build the book consumers of the future.


Market Failures Linked to Types of Material

A second failure is linked to types of material. Many of the works held by libraries are ‘orphan’ – i.e. the author is either not known, or not traceable.

This is a common phenomenon, given the very long duration of copyright, as well as the fact that copyright also applies to works which were never made for commercial purposes (and so where fewer records have been kept).

The problem comes from the fact that by default, copyright locks these works away, as the (unknown) author is assumed not to have agreed to their work being used.

The consequence is that this leaves large parts of library collections locked away, despite a low risk of objections to their being shared online (indeed, many people who do come back are happy about it), and lost potential value for researchers and historians.


Market Failures Linked to Type of Use

A third category of market failure is linked to the type of use that is planned. This is an issue because copyright not only governs who can sell books and other works, but also what can be done with them afterwards.

There are arguably certain activities – quotation, basic educational uses, preservation – which are of clear public benefit. However, the last two of these are, by default, also left in the hands of rightholders.

To take the example of preservation, the benefits of this may only be felt in many years to come, or if something deeply uncertain, such as a disaster, strikes.

Yet this is not something that can easily be translated into money, or something that the rightholder taking the decision will necessarily take into account. Indeed, they may logically focus more on the idea of a lost sale (however unlikely this is), or the risk of hacking or loss. Again, by default, preservation is not permitted.

In effect, if the right to preserve works effectively is not covered in law, there is a real risk of books and other works being lost.


Market Failures Linked to Lack of Coordination

The examples of given up to here have been more focused on the decisions taken by rightholders, and represent market failures. But there are also failures associated with policy-making around copyright.

This is because when policies are decided – and in particular, when copyright exceptions are designed – the focus is on domestic interests. There is little if any consideration of how the choices make will affect researchers, teachers and libraries working across borders.

It seems unlikely that anyone would want to prevent libraries from working together across borders in order to carry out preservation, or to share works in a fair and regulated way. These activities are just too easily forgotten.

If these interests were taken into account, there would be a far stronger argument for convergence in copyright exceptions in order to support research, heritage and learning.


As highlighted in the recent WIPO meeting, the Marrakesh Treaty is a response to a market failure – one that ensures that the wider interests of society can be promoted within the context of the copyright system. It is a means of dealing with a problem created by the way copyright works, with exclusive rights by default, and little consideration for cross-border working.

These failures are not the fault of rightholders either, who are acting rationally in the circumstances. They have a duty to maximise revenues in order to support themselves or their authors (and shareholders as appropriate), and are not being deliberately unhelpful.

Such failures can be addressed through exceptions to copyright. It is time to do so, both at the national and global level.

2 Days to Human Rights Day: The Right to Culture

Image for 2 Days to Human Rights Day Blog - the right to cultural participationAt two days to Human Rights Day 2018, the second-to-last of IFLA’s daily blogs looks at the right to participate in the cultural life of the community, or in short, the right to culture. 

Amongst policy areas, culture is often seen as one of the least important. It rarely grabs the headlines in the same way as security, education or defence.

As such, it can seem like an easy area to cut when there is a need to make savings. Something that is nice, but not necessary.

Yet the Universal Declaration of Human Rights offers a strong counter-argument. Article 27 underlines that ‘Everyone has the right freely to participate in the cultural life of the community’.

This offers a confirmation of the central role of culture in the development of individuals and society, and the duty of governments to ensure that all can access it.

This is also an affirmation of one of the core roles of libraries, alongside promoting education and research. Our institutions provide a gateway to literature, from children’s books and bestsellers to the classics. They are key vehicles for delivering cultural policy – and human rights.

Yet as with the rest of the Universal Declaration, there is no obligation to deliver access to culture in any particular way. Is it more appropriate to focus efforts on those who cannot afford access in any other way, or should solutions be universal?

This blog looks at this question from the perspective of library services.


Levellers: Targeted Support to Enhance Access

Culture is not necessarily cheap. For people to be able to devote their time to writing, to theatre, or to other creative activities, they need – and deserve – support. Indeed, Article 27b of the Universal Declaration recognises this right to the material benefits of creativity.

Many others add value, through perfecting works, and then helping distribute them.

A variety of mechanisms are in place to support this activity, such as subsidies, benefits, or tax cuts. Yet selling works – books, films, plays, art – to consumers remains the key source of income in most cases.

For consumers who have a solid income already, this is clearly not a problem.

Yet this is not the case for everyone. In the case of young parents, for example, this can be crucial, as the cost of buying all the books a child will read can be high.

Libraries do indeed have a particularly important role in providing access to culture for people who may not otherwise be served by the market. This of course includes those who, in future, will earn more and buy more books.

Evidence from the United States indicates higher level of reliance on libraries by groups more likely to be marginalised. This suggests the potential of libraries as ‘levellers’ when it comes to access to culture.


A Universal Offer

While targeted support may be more cost-efficient in the immediate term, it implies differentiating between groups in society.

It is unfortunately the case that when a service is seen as something for the ‘poor’, people will start to avoid it out of pride. Some will be excluded, despite the need they face.

This is why the nature of libraries as a universal public service is so important. They are explicitly for everyone, not just specific groups.

And while they may have a particular duty to help people more at risk of exclusion from culture – such as those with low literacy or people with disabilities – this is not at the expense of their broader community role.

Libraries themselves work to build collections and services that respond to the needs of everyone.

And while this may mean that the possibility to borrow books is open to all, this can act as a powerful discovery tool, giving new authors an opportunity to meet new readers. Libraries, of course, also buy content, providing an important source of income to authors.

The universal focus of libraries also makes them more attractive as a meeting place for all members of the community. With few other public spaces for groups to come together, this can be a key driver of social cohesion.


The right of access to culture is perhaps one of the strongest bases for the existence – and activity of libraries.

In order to drive equity – equality of outcomes – they may need to make special efforts with some groups. But, crucially, it is their universal focus – to allow everyone to participate in cultural life – that can make libraries so effective.


Read also IFLA’s submission to the call for contributions on the tenth anniversary of the mandate of the UN Special Rapporteur on Cultural Rights.