In the final post both of this mini-series on libraries and cultural data, and of our regular Library Stat of the Week posts, we return to a core function of libraries – to promote reading and access to books.
In the past three weeks, we have looked at data around how much households spend on books, as well as on wider data around participation in artistic and cultural activities. In each case, it appears that having more libraries, and using them better, is linked to greater spending and engagement.
This week, we look at data on how people spend their time, and in particular on how many people read regularly, and then how long they spend doing it.
For many, simply encouraging more reading is an end in itself, although of course this can also have positive impacts on issues such as wellbeing (a key issue during the pandemic!), literacy (skills can deteriorate if not used) and of course on the health of the wider cultural sector.
Once again, we are drawing on data from Eurostat, and in particular the Time Spent on Cultural Activities dataset (gathered between 2008 and 2015). Given its focus, it only covers countries in Europe, but offers insights that can apply elsewhere. As ever, data on libraries comes from the IFLA Library Map of the World, crossed with World Bank population data.
To set the scene, we can look already at what we know about people’s habits around reading, in particular throughout their lives.
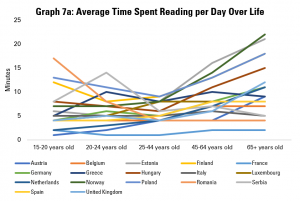
Graph 7a does this by looking at the average time spent reading per day per person, broken down by different age groups. It shows that, in general, there is a U-shaped curve, with people reading more when they are younger and when they are older, with 25-44 year olds reading least on average.
There are exceptions within this. For example, Romanian 15-20 year olds on average read more than any others in Europe. However, older Romanians (aged 65+) are the second least regular readers. Meanwhile, young Austrians and Dutch are low readers, but their parents and grandparents on average spend a much more average amount of time reading.
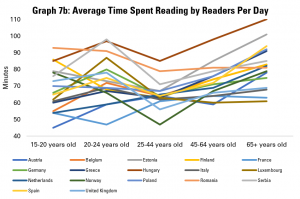
Graph 7b looks only at those people declaring that they do read regularly, and explores how long they spend doing this. While there is, again, a dip in average time spent reading among the 25-44 age group, this is less dramatic. Hungarian readers show up across all age groups as one of the nationalities that reads most when they do.
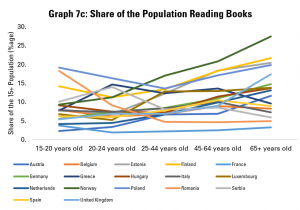
The other driver of overall figures on how much people read on average is data about the share of the population reading at all. Graph 7c explores this, noting that the share of the population reading in general tends to be relatively stable, or drop between 15-20 and 25-44 year olds, and then rise relatively sharply among older groups. For example, while only an average share of younger Norwegians read, a larger share of older Norwegians than in any other country covered read. Similarly, from coming almost bottom of the class among younger groups, the older Dutch and Austrians come around average when it comes to the share of older people reading.
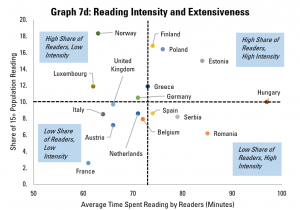
We can get an overview of the extensiveness (i.e. share of the overall population reading) and intensity (time spend reading by those who do) in Graph 7d, which looks at populations as a whole.
This shows us that Finland, Poland and Estonia do not just have an above average share of readers in the population, but those who do read tend to do so for longer. In contrast, Italy, France, Austria, the Netherlands, Belgium and the United Kingdom have both a below-average share of readers in the population, and those who do read do so for shorter times than average.
Finally, there is a contrast between Norway, Luxembourg and Germany (more readers, but reading for shorter times), and Spain, Serbia and Romania (fewer readers, but those who do read for longer). A separate analysis of the situation for different age groups could also be interesting here, in order to understand whether the main challenge in increasing reading is to allow more time for this, or to get more people reading in the first place.
Having looked at reading habits, it is now time to look at the relationship between libraries and reading.
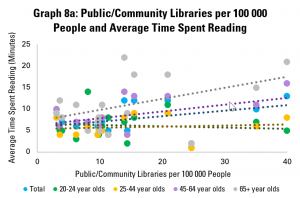
Graph 8a looks at the availability of public and community libraries, as measured by the number of libraries per 100 000 people, compared to the average time spent reading by different age groups. It finds that there is a positive correlation for the population as a whole, mainly driven by older readers (those aged 45-64 and 65+). The link is less obvious for younger readers (aged 20-24 and 25-44).
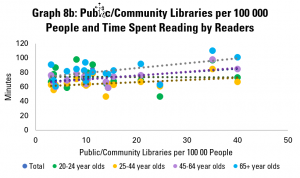
Graph 8b looks at the amount of time spent reading by those who do read. This again shows a gentle, but positive correlation – in other words, in countries with more public and community libraries, those people who do read tend to spend more time doing so. Looking across age groups, the correlation is positive for all, although only slightly in the case of 20-24 year olds.
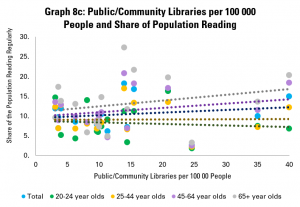
Graph 8c looks at numbers of public and community libraries, and the share of the population in different age groups reading. Again, it finds weak but positive correlation between numbers of libraries and tendency to read, with stronger links for older groups. The picture is similar if we look only at countries with up to 20 public or community libraries per 100 000 people.
Overall, the story from this is that pure numbers of libraries are positively linked with how many people read, and how much they do, but not particularly strongly.
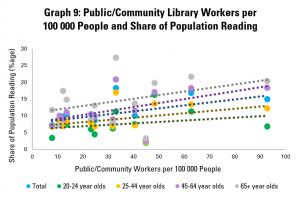
Graph 9 goes a little further, looking rather at numbers of public and community library workers. This is, arguably, a stronger indicator of how much is being invested in the library field, as well as its ability to reach out to readers, welcome them, and support literacy.
This shows a more positive link between the strength of the library field and share of adults reading, with an increase of 10 library workers per 100 000 people tending to be linked to a rise of 1% in the share of the population reading (or 1000 people). This arguably makes sense – library staff have a key role in helping readers find books that interest them, and simply in making libraries into welcoming places.
Once again, the connection is stronger in older groups. Interestingly, it does not appear that those who do read spend more time doing so in countries with more public and community library workers.
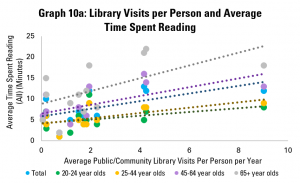
Yet as in previous posts, the strength of the library field is only part of the picture – so too is how well it is used. Graph 10a does this, using data on average library visits per person per year. It shows a positive correlation between library visits and the length of time adults in general spend on reading per year, again with more positive links among older groups.
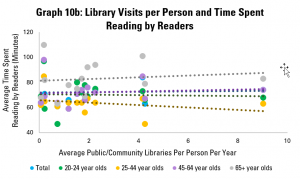
Graph 10b looks at how long those adults who read do so on average. Here, the picture is similar to that in Graph 8b, with a weakly positive correlation. Again, it appears that there is little link between libraries and how long people spend reading.
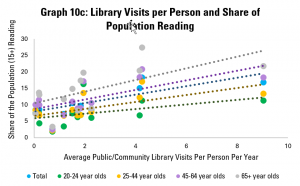
Graph 10c however looks at the share of the adult population that reads, and once again displays a strong and positive correlation. Across the population as a whole, an increase of one library visit per person per year tends to be associated with a 1.28 percentage point rise in the share of the population reading.
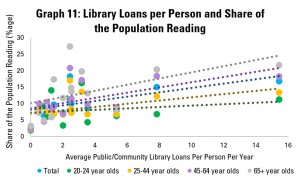
Graph 11 repeats this last analysis, but with the average number of loans from public and community libraries per person per year. Again, there is a relatively strong positive correlation, with an extra library loan per person per year associated with a 0.6 point rise in the share of adults reading. As in Graph 10c, the connection holds for all age groups, although is stronger for older ones.
What can we conclude from this? First of all, that there are significant differences in reading habits across the European countries surveyed by Eurostat. High performance – as measured by a high average length of time spent reading per person – can be influenced by the number of people reading, and how long they read for. This performance matters, given the role of reading in maintaining and strengthening skills, in promoting wellbeing, and in providing demand for writing.
Looking at the connections with libraries, it seems that there are much stronger links between libraries and the share of the population reading than between libraries and how long people spend reading.
While correlation is not causality, the data shared here would support the argument that libraries can play a role in getting more people reading, and so in helping more people benefit in terms of skills and wellbeing. In particular, numbers of library staff appear to matter more than numbers of libraries, and levels of use of libraries have a stronger link still.
This would imply that a key focus of governments looking to boost reading will likely be to ensure that libraries are well-staffed and welcoming for all.
Throughout, the relationship between public and community libraries and numbers of people reading seems weakest in general for younger groups. To some extent, this may be because many younger people have access to university libraries (in the case of 20-24 year olds in particular), or just because of less inclination to read in general among 25-44 year olds. It can also be underlined that the importance of reading for skills is more important among older groups in any case.
Nonetheless, this does raise interesting questions about whether more can be done to increase reading among 25-44 year olds, and whether libraries can strengthen their role in this.
Find out more on the Library Map of the World, where you can download key library data in order to carry out your own analysis! See our other Library Stats of the Week! We are happy to share the data that supported this analysis on request.