Tag Archives: library data

Using Library Map of the World Data as SDG Indicators

Alongside the 17 Sustainable Development Goals, a core focus of the United Nations 2030 Agenda is the importance of tracking progress. The two go together; there is little point in setting objectives without establishing also a means of tracing how well countries are doing in achieving them.

In order to support this at the global level, the United Nations has established a list of 231 unique indicators. Member States are encouraged to collect and present data for these (where methodologies have been agreed), as well as finding other metrics that can help track progress towards the SDGs.

This blog sets out ways in which you can propose datasets collected for IFLA’s Library Map of the World as indicators of progress towards the SDGs.

The Limits and Possibilities of Library Map of the World Data as SDG Metrics

In each case below, it is argued that library data can be used as a proxy for something that matters, such as how much a society is investing in equality or lifelong learning, or how much people are using community spaces.

Clearly, these are just proxies. First of all, in the absence of wide-ranging household surveys, it is difficult to show specific causality between library data and specific outcomes at a national or regional level, a point also made in the EBLIDA report on SDG Indicators in European libraries.

Nonetheless, there are correlations which allow us to make certain points in our advocacy about how strong and well-used library fields tend to be associated with various positive outcomes (see our Library Stat of the Week series for more).

It should be noted, in contrast, that in the context of individual projects, it is possible to gather feedback and results from participants which can indicate what is possible, as illustrated in the SDG Stories on IFLA’s Library Map of the World.

More fundamentally, the fact that the UN is using 231 indicators underlines that measuring progress towards the SDGs relies not on any one single metric or index, but on a wide range of them. As this blog argues, library data certainly can have its place in the mix.

Number of libraries

First of all, the number of public or community libraries in a country can be used as an indicator of how strong the infrastructure is for supporting literacy and lifelong learning (SDGs 4 and 8), as well as providing community space (SDG 11), a basic service for all (SDG 1), and as a place for accessing eGovernment (SDG16). With the role of culture recognised in delivering the SDGs as a whole, you can also use this data as an indicator of levels of access to culture.

You can provide figures for numbers of libraries per person in order to compare the situation in your country with those elsewhere, or calculate the average area served by each library to indicate how far people are, on average from a library.

The number of school libraries, in those countries which have not given school library responsibilities to public libraries, can be a further indicator of quality education (SDG 4). If you can find how many schools there are in your country, you can indicate what share of these do, or do not, benefit from library services. As highlighted in our analysis of Voluntary National Reviews so far, the presence (or absence) of school libraries is often seen as an indicator of the strength of the wider education system.

Numbers of academic and research libraries can serve as an indicator of the quality of the infrastructure for supporting research and innovation (SDG9), as well as for supporting success of all students (SDG4).

Finally, the existence of a national library can provide an indication of the development of institutions in general (SDG16), given the role of these libraries in supporting the wider book sector, and in ensuring the preservation of the historical record for future generations.

Number of library workers

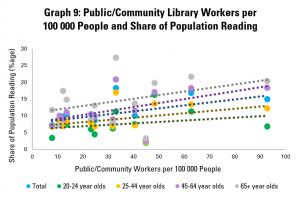
Where available, numbers of library workers can be presented as providing a more accurate idea of the strength of the library field, and so of the infrastructure for supporting education and literacy (SDG4), skills development and job-seeking (SDG8), access to culture and other services (SDG1), community-building (SDG11) and research (SDG9).

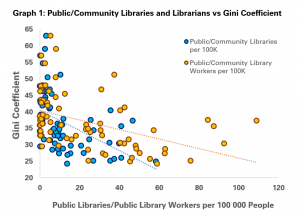
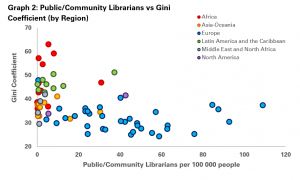
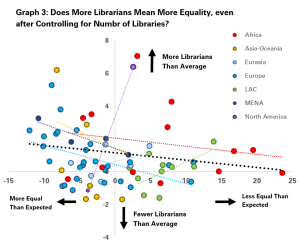
In particular, numbers of library workers correlate much more strongly than numbers of libraries with outcomes such greater equality (both between women and men, and on other dimensions such as immigrant background and wealth). As such, numbers of libraries can provide an indicator of investment in pro-equity policies (SDGs 5 and 10).

Once again, you can calculate numbers of library workers per million people or per student in order to develop a comparable idea of the strength of libraries and library services in your country. This approach also allows you to cancel out the impact of a tendency to more but less well-staffed libraries in some countries, and fewer but better-staffed libraries in others.

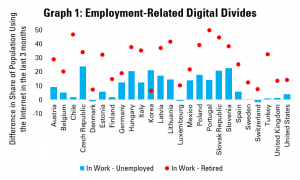
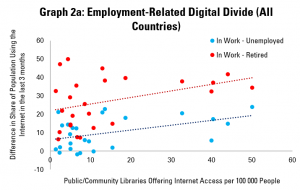
Libraries with internet access

The digital divide remains a reality, defined not just as the gap between those with and without internet access, but also between those who have the confidence and competence to use the internet effectively, and those who do not.

Libraries have an acknowledged role not only in bringing people online, but also in fostering the skills needed to make safe and effective use of the internet, with a strong focus on groups which might otherwise be excluded.

As such, you can propose data on the number of libraries providing internet access as an indicator of how effectively a country is providing support for everyone to make the most of the internet (SDGs 5, 9 and 17). In particular, you may want to focus on the number of libraries offering internet access per million people (as a way of allowing comparisons with other countries), and the share of libraries which are offering internet access.

Numbers of visits and registered users

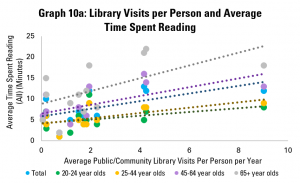
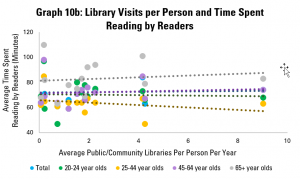
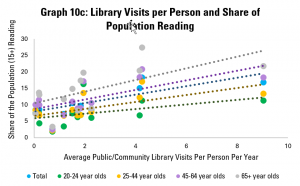
Moving from the strength of the library field to the use made of it, data about the number of visits to libraries per year, and the share of the population registered can be proposed as an indicator of the effectiveness of government policies around education, culture, research and community activities.

For example, Finland used data on library visits as a metric of engagement in learning in its 2020 Voluntary National Review (SDG4). Visits to libraries also tend to correlate with wider engagement in culture, which is relevant across the SDGs. Numbers of visits can also be used as an indicator of level of use of public spaces (SDG11).

Numbers of loans

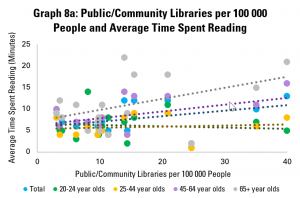
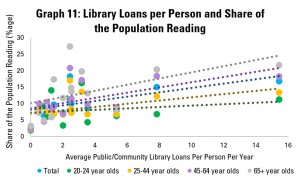
Another indicator of levels of use of libraries, at least in their core role of supporting reading and research, is the number of loans they make. You can calculate this on a per-person basis, at least if you have national-level data.

While, arguably, lending books is only one part of the work of many libraries now, it can still be used as an indicator of engagement in reading and learning (SDG4), and research (SDG9) as well as of wider cultural engagement.


Hopefully, the ideas in this blog give you can idea of how you may be able to propose library data to the authorities responsible for tracking progress towards the SDGs. Depending on what your country is already doing – and the data you have available – you will want to adapt your message of course. In particular if your country is carrying out a Voluntary National Review, there may be interesting opportunities to engage.

Let us know how you get on!


Library Stat of the Week #50 (Part 2): Where there are stronger and better used public and community libraries, more people read, more often

In the final post both of this mini-series on libraries and cultural data, and of our regular Library Stat of the Week posts, we return to a core function of libraries – to promote reading and access to books.

In the past three weeks, we have looked at data around how much households spend on books, as well as on wider data around participation in artistic and cultural activities. In each case, it appears that having more libraries, and using them better, is linked to greater spending and engagement.

This week, we look at data on how people spend their time, and in particular on how many people read regularly, and then how long they spend doing it.

For many, simply encouraging more reading is an end in itself, although of course this can also have positive impacts on issues such as wellbeing (a key issue during the pandemic!), literacy (skills can deteriorate if not used) and of course on the health of the wider cultural sector.

Once again, we are drawing on data from Eurostat, and in particular the Time Spent on Cultural Activities dataset (gathered between 2008 and 2015). Given its focus, it only covers countries in Europe, but offers insights that can apply elsewhere. As ever, data on libraries comes from the IFLA Library Map of the World, crossed with World Bank population data.

To set the scene, we can look already at what we know about people’s habits around reading, in particular throughout their lives.

Graph 7a: Average Time Spent Reading per Day Over Life

Graph 7a does this by looking at the average time spent reading per day per person, broken down by different age groups. It shows that, in general, there is a U-shaped curve, with people reading more when they are younger and when they are older, with 25-44 year olds reading least on average.

There are exceptions within this. For example, Romanian 15-20 year olds on average read more than any others in Europe. However, older Romanians (aged 65+) are the second least regular readers. Meanwhile, young Austrians and Dutch are low readers, but their parents and grandparents on average spend a much more average amount of time reading.

Graph 7b: Average Time Spent Reading by Readers Per Day

Graph 7b looks only at those people declaring that they do read regularly, and explores how long they spend doing this. While there is, again, a dip in average time spent reading among the 25-44 age group, this is less dramatic. Hungarian readers show up across all age groups as one of the nationalities that reads most when they do.

Graph 7c: Share of the Population Reading Books

The other driver of overall figures on how much people read on average is data about the share of the population reading at all. Graph 7c explores this, noting that the share of the population reading in general tends to be relatively stable, or drop between 15-20 and 25-44 year olds, and then rise relatively sharply among older groups. For example, while only an average share of younger Norwegians read, a larger share of older Norwegians than in any other country covered read. Similarly, from coming almost bottom of the class among younger groups, the older Dutch and Austrians come around average when it comes to the share of older people reading.

Graph 7d: Reading Intensity and Extensiveness

We can get an overview of the extensiveness (i.e. share of the overall population reading) and intensity (time spend reading by those who do) in Graph 7d, which looks at populations as a whole.

This shows us that Finland, Poland and Estonia do not just have an above average share of readers in the population, but those who do read tend to do so for longer. In contrast, Italy, France, Austria, the Netherlands, Belgium and the United Kingdom have both a below-average share of readers in the population, and those who do read do so for shorter times than average.

Finally, there is a contrast between Norway, Luxembourg and Germany (more readers, but reading for shorter times), and Spain, Serbia and Romania (fewer readers, but those who do read for longer). A separate analysis of the situation for different age groups could also be interesting here, in order to understand whether the main challenge in increasing reading is to allow more time for this, or to get more people reading in the first place.


Having looked at reading habits, it is now time to look at the relationship between libraries and reading.

Graph 8a: Public/Community Libraries per 100 000 People and Average Time Spent Reading

Graph 8a looks at the availability of public and community libraries, as measured by the number of libraries per 100 000 people, compared to the average time spent reading by different age groups. It finds that there is a positive correlation for the population as a whole, mainly driven by older readers (those aged 45-64 and 65+). The link is less obvious for younger readers (aged 20-24 and 25-44).

Graph 8b: Public/Community Libraries per 100 000 People and Time Spent Reading by Readers

Graph 8b looks at the amount of time spent reading by those who do read. This again shows a gentle, but positive correlation – in other words, in countries with more public and community libraries, those people who do read tend to spend more time doing so. Looking across age groups, the correlation is positive for all, although only slightly in the case of 20-24 year olds.

Graph 8c: Public/Community Libraries per 100 000 People and Share of Population Reading

Graph 8c looks at numbers of public and community libraries, and the share of the population in different age groups reading. Again, it finds weak but positive correlation between numbers of libraries and tendency to read, with stronger links for older groups. The picture is similar if we look only at countries with up to 20 public or community libraries per 100 000 people.

Overall, the story from this is that pure numbers of libraries are positively linked with how many people read, and how much they do, but not particularly strongly.

Graph 9: Public/Community Library Workers per  100 000 People and Share of Population Reading

Graph 9 goes a little further, looking rather at numbers of public and community library workers. This is, arguably, a stronger indicator of how much is being invested in the library field, as well as its ability to reach out to readers, welcome them, and support literacy.

This shows a more positive link between the strength of the library field and share of adults reading, with an increase of 10 library workers per 100 000 people tending to be linked to a rise of 1% in the share of the population reading (or 1000 people). This arguably makes sense – library staff have a key role in helping readers find books that interest them, and simply in making libraries into welcoming places.

Once again, the connection is stronger in older groups. Interestingly, it does not appear that those who do read spend more time doing so in countries with more public and community library workers.

Graph 10a: Library Visits per Person and Average Time Spent Reading

Yet as in previous posts, the strength of the library field is only part of the picture – so too is how well it is used. Graph 10a does this, using data on average library visits per person per year. It shows a positive correlation between library visits and the length of time adults in general spend on reading per year, again with more positive links among older groups.

Graph 10b: Library Visits per Person and Time Spent Reading by Readers

Graph 10b looks at how long those adults who read do so on average. Here, the picture is similar to that in Graph 8b, with a weakly positive correlation. Again, it appears that there is little link between libraries and how long people spend reading.

Graph 10c: Library Visits per Person and Share of Population Reading

Graph 10c however looks at the share of the adult population that reads, and once again displays a strong and positive correlation. Across the population as a whole, an increase of one library visit per person per year tends to be associated with a 1.28 percentage point rise in the share of the population reading.

Graph 11: Library Loans per Person and Share of the Population Reading

Graph 11 repeats this last analysis, but with the average number of loans from public and community libraries per person per year. Again, there is a relatively strong positive correlation, with an extra library loan per person per year associated with a 0.6 point rise in the share of adults reading. As in Graph 10c, the connection holds for all age groups, although is stronger for older ones.


What can we conclude from this? First of all, that there are significant differences in reading habits across the European countries surveyed by Eurostat. High performance – as measured by a high average length of time spent reading per person – can be influenced by the number of people reading, and how long they read for. This performance matters, given the role of reading in maintaining and strengthening skills, in promoting wellbeing, and in providing demand for writing.

Looking at the connections with libraries, it seems that there are much stronger links between libraries and the share of the population reading than between libraries and how long people spend reading.

While correlation is not causality, the data shared here would support the argument that libraries can play a role in getting more people reading, and so in helping more people benefit in terms of skills and wellbeing. In particular, numbers of library staff appear to matter more than numbers of libraries, and levels of use of libraries have a stronger link still.

This would imply that a key focus of governments looking to boost reading will likely be to ensure that libraries are well-staffed and welcoming for all.

Throughout, the relationship between public and community libraries and numbers of people reading seems weakest in general for younger groups. To some extent, this may be because many younger people have access to university libraries (in the case of 20-24 year olds in particular), or just because of less inclination to read in general among 25-44 year olds. It can also be underlined that the importance of reading for skills is more important among older groups in any case.

Nonetheless, this does raise interesting questions about whether more can be done to increase reading among 25-44 year olds, and whether libraries can strengthen their role in this.


Find out more on the Library Map of the World, where you can download key library data in order to carry out your own analysis! See our other Library Stats of the Week! We are happy to share the data that supported this analysis on request.

The 10-Minute International Librarian #17: Think about how you can measure success

The test of a great idea is in its delivery.

In order to understand whether a service or programme is working, it’s important to be able to see whether it is meeting its goals.

But also, proof of what you have achieved is also powerful when advocating.

Politicians will meet lots of enthusiastic people with great ideas. But what should work best in changing their minds is evidence.

Libraries can better protect and improve their situation when they can make it clear how they are contributing to their communities.

So for our 17th 10-Minute International Librarian exercise, think about how you can measure success.

There are different ways of doing which could fit to your own situation, from stories from individuals to statistics, from the way people feel (did they appreciate what you did?) to life-changes.

Looking through stories on IFLA’s Library Map of the World will give you some great ideas from libraries elsewhere. You can also learn more in our Storytelling Manual.

Thinking about measurement early also pays off, as it means you can collect feedback as you deliver any service or programme.

Share your stories on measuring success in the comments below!

Good luck!


This idea relates to the IFLA Strategy! 3.3 Develop standards, guidelines, and other materials that foster best professional practice.

As we publish more ideas, you will be able to view these using the #10MinuteInternationalLibrarian tag on this blog, and of course on IFLA’s Ideas Store! Do also share your ideas in the comments box.

Library Stat of the Week #35: Where there are more libraries offering internet access, being out of work is less likely to mean that people are also offline

Over the past weeks, we have looked at data around digital divides, and to what extent these cross over with other potential divides in society – rich and poor, women and men, old and young, and those with higher or lower formal qualifications.

It is valuable to look at this because the results help understand to what extent the internet can act as a bridge across divides, or rather deepen them further.

Ideally, access to the web should help those who are disadvantaged find new opportunities and information in order to improve their own lives, as well as those of the people around them.

However, where access is lacking, the fortunate – those who can use the internet – can get ahead, while those without drop further and further behind. This has been abundantly clear during the COVID-19 pandemic, with children lacking internet access unable to take part in education in the same way as their better connected peers.

It is also the case for those facing unemployment. People seeking work can do so much more easily with access to the internet, both to find openings, and to develop skills or access support.

People who are retired can also risk being cut off without internet access, for example limiting contact with friends and family, governments services, and eHealth possibilities. Older people may also feel less confident online, and feel the need for additional support.

In both cases, libraries can provide a great way to ensure that everyone can get online and make the most of the internet.

This blog therefore looks at digital divides between those in work on the one hand, and those who are unemployed or retired on the other. Once again, data on internet use comes from the OECD’s database on ICT Access and Usage by Households and Individuals, while data on libraries offering internet access comes from IFLA’s Library Map of the World.

Graph 1: Employment-Related Digital Divides

Graph 1 looks at the state of the employment-related digital divide, for countries for which data is available. In almost all countries, a greater share of people in employment have used the internet in the last three months than those who are unemployed.

Only Denmark, Luxembourg and Switzerland buck the trend. In the Czech Republic, Hungary, Korea, Slovenia and Slovakia, the gap is over 20 percentage points.

Meanwhile, in no country are retired people more likely to use the internet than people in work, with the gap reaching over 40 points in Chile, Lithuania, Portugal and the Slovak Republic.

Graph 2a: Employment-Related Digital Divides and Internet Access in Public Libraries (All Countries)

Graph 2a crosses these figures with those for the number of public or community libraries offering internet access. Each dot represents a country, with the number of public or community libraries offering internet access on the horizontal (X) axis, and the gap in shares of the population using the internet (employed minus unemployed (blue dots) or retired (red dots)) on the vertical (Y) axis.

As with previous weeks, putting together the figures for all countries suggests that there is a positive correlation between the number of libraries offering internet access per 100 000 people, and the size of the digital divide – clearly not an encouraging result!

However, as we have seen in previous weeks, it is worth breaking out the results for Central and Eastern Europe, given the particular history of these countries

Graph 2b: Employment-Related Digital Divides and Internet Access in Public Libraries (without Central and Eastern Europe)

Graph 2b – using data from countries outside of Central and Eastern Europe – therefore shows a very different picture, in line with what we have seen in previous weeks. Where there are more libraries offering internet access, the digital divide faced by people who are out of work or retired, compared to their in-work peers, tends to be smaller.

Indeed, it appears that for every additional public library per 100 000 people offering access, the digital divide for the retired falls by 1 percentage point, and that for the unemployed falls by 0.55 percentage points.

Graph 2c: Employment-Related Digital Divides and Internet Access in Public Libraries (Central and Eastern Europe)

Graph 2c repeats the analysis for countries in Central and Eastern Europe for which we have data, again indicating that where there are more libraries offering internet access, divides are smaller.


As always, the analysis carried out here cannot show causality – only correlation. However, it supports the argument that it is in societies with more libraries offering internet access that people who most need to access the internet face smaller barriers to doing so.

With COVID-19 risking exacerbating divides in societies, this is a powerful point to make in underlining why maintaining and broadening internet access through libraries matters more than ever.


Find out more on the Library Map of the World, where you can download key library data in order to carry out your own analysis! See our other Library Stats of the Week! We are happy to share the data that supported this analysis on request.

What’s on the Agenda for Libraries and the SDGs in the Rest of 2020?

2020 has been a big year for the Sustainable Development Goals (SDGs). A third of the way into the time Member States gave themselves for their implementation, there is only a decade left to deliver.

Clearly, this is not the only way in which 2020 has not been a normal year.

Following the African Regional Forum on Sustainable Development in February, all other regional meetings on the SDGs were held virtually or simply postponed. Similarly, the 2020 High Level Political Forum took place online.

However, work has continued, and indeed is as important as ever as the world looks to make progress while also dealing with the consequences of the pandemic.

This emphasis on the need to accelerate efforts to make a reality of sustainable development will therefore mark the last four months of the year, and bring with it opportunities for libraries to highlight the role they can play.

Here are just a few of those opportunities:

18 September – SDG Moment: in the context of the United Nations General Assembly, there will be a morning where heads of state and government will underline their commitment to the SDGs. For those countries participating (the list is not yet available), this could be an opportunity to underline your work around the SDGs on social media. Find out more here.

18-25 September – Global Goals Week: also taking place at the time of the UN General Assembly, Global Goals Week offers a programme of events and activities, online, that run from the 18 September SDG moment to the anniversary of the agreement of the UN 2030 Agenda on 25 September. In particular, look out for the global day of factivism on 25 September, where people will share facts that set out how the world is doing towards achieving the SDGs – a perfect opportunity for the library field to show what it can do! Find out more here.

28 September – International Day for the Universal Access to Information: September is a busy month! Following four years as a UNESCO international day, last year, the UN General Assembly upgraded the International Day for the Universal Access to Information to a UN-level observance. With a strong focus on the power of information to improve lives, it’s a great opportunity to share how libraries make a difference, through social media, op-eds, or letters to newspapers, radio or TV shows. Find out more here.

October – Urban October: the month of October opens with World Habitat Day on 5 October, and ends with World Cities Day on 31 October. With libraries playing a major and acknowledged role in promoting inclusion and social cohesion, it’s a great time to be highlighting how libraries build communities. IFLA will be planning communications around the celebrations and will share information in due course, but you also can register events on the Urban October website. Find out more here.

19-21 October – World Data Forum: while it will not be possible to meet in person, the virtual World Data Forum provides a great learning opportunity for anyone interested in how statistics are being – or can be – used to strengthen efforts to deliver the SDGs. IFLA will be highlighting its own statistical outputs – and what you can do with them – with a special focus on World Statistics Day on 20 October. Find out more here.

24 October – UN Day/World Development Information Day: another opportunity to highlight how libraries and information contribute to sustainable development is World Development Information Day. This can be an opportunity to show how libraries are supporting research addressing major development challenges, and so accelerating progress towards the SDGs! Find out more here.


There are also ongoing projects where you can play a role:

Gather stories and data to power your advocacy! You can help both yourself and colleagues elsewhere in the world by contributing stories, data and country profiles to the Library Map of the World. Find out more on the website.

Establish or refresh your contacts with SDG leads in your country: do the people responsible for delivering on the SDGs in your country know about what libraries can provide? Try to find out who is in charge in government and parliament, as well as among civil society organisations. There are great examples from Brazil and Costa Rica of the benefits of forming these links.

Get involved in preparing your country’s Voluntary National Review: for the countries which will undertake Voluntary National Reviews (VNRs) of progress towards the SDGs in 2021, it is useful to try and understand early what the process will be. A provisional list is already available, and will be finalised soon. If your country is on there, find out how the process will be run, and consult our guide on engaging in VNRs.


Good luck, and please do share your plans, either in the comments below or by e-mailing us at da2i@ifla.org!

Text and Data Mining: (Articles 3 and 4 of the EU-DSM) by REBIUN’s Copyright working group

The Copyright working group of REBIUN (the network of university libraries in Spain) is formed of Silvia Losa, as coordinator of the group, and librarian in the Universitat Pompeu Fabra in Barcelona, Paloma Jarque, librarian in the Universidad Carlos III in Madrid, Rosa Mª Sánchez, librarian in UNED, and Patricia Sanpera, librarian in the Ilustre Colegio de la Abogacía de Barcelona. The group studies topics of interest on copyright for university libraries in Spain. We are currently monitoring the transposition process to guide REBIUN in the actions to be carried out in order to get legislation in line with the interests of libraries.

  1. Can you explain to us what Articles 3-4 of the EU-DSM Directive are?

Articles 3-4 of the DSM Directive introduce two exceptions to copyright for text and data mining.

Text and data mining (TDM) is defined as “any automated analytical technique aimed at analysing text and data in digital form in order to generate information which includes but is not limited to patterns, trends and correlations”.

Article 3 focuses on text and data mining for the purposes of scientific research.

The article covers the reproduction, and extraction from databases, made by research organisations and cultural heritage institutions (and their members) but only for scientific research purposes. It also covers the storage and retention of copies, for the same purposes, including the verification of research results.

A cultural heritage institution includes “publicly accessible library or museum, an archive or a film or audio heritage institution”. Art. 2(3)

Research organisations are basically not-for-profit entities or entities tasked by a Member State with a public service research mission, according to art. 2(1).

The exception covers text and data mining of “works or other subject matter to which they have lawful access”. That means all the collections of institutions like libraries but also those contents freely available online.

This exception is not subject to remuneration (recital no. 17) and is protected against contract override. Art. 7(1)

Rightholders may establish measures to ensure the security of their systems but they should not prevent the application of the exception. Copies generated by text and data mining should be stored securely. Member States may regulate both aspects after negotiation with stakeholders (including, therefore, libraries).


Article 4 allows acts of “reproductions and extractions of lawfully accessible works and other subject matter for the purposes of text and data mining”.

Text and data mining can be done for any purpose and the reproductions “may be retained as long as necessary for the purposes of text and data mining.” Art. 4(2)

The exception benefits all kind of users, institutions or individuals, who have lawful access to contents. That means all the collections of the organisation but also the open web.

This exception, unlike the previous one, can be overridden by contract.

According to art. 4(3) “the exception or limitation shall apply on condition that the use of works […] has not been expressly reserved by their rightholders in an appropriate manner, such as machine-readable means in the case of content made publicly available online”.


  1. Why are these items important to libraries?

An exception for ‘text and data mining’, TDM, as stated in articles 3 and 4 of the EU-DSM Directive, grants libraries the right to mine in copyright works to which they have lawful access.

Text and data mining, TDM, is important for research and academic libraries because this exception allows them to support researchers and other legitimate users from different disciplines to undertake data mining. This support includes giving them access to legally accessed materials, not only on-site but remotely, and with the right to keep secure copies.

There are some aspects of the activity of libraries that can be closely related to text and data mining.

Libraries are supporters of Open Science, as they do with their institutional repositories. Open Science, including, inter alia, open access, open data, and FAIR data, is a loyal friend for TDM. With such a friend, researchers and other legitimate users will successfully carry out automated text and data analysis. Open Science is based on the possibility of checking out researchers’ methods and data. Without the opportunity to look at the datasets used for analysis, other researchers cannot confirm, or disapprove, findings, undermining overall scientific progress.

Libraries are used to work together with IT and Legal Departments. For the sake of an ideal use of the exception in favour of researchers and other legitimate users, libraries can help TDM workflows and infrastructures to be applied and developed.

As beneficiaries of the exception, and as advocates of researchers and other legitimate users from their institutions, libraries can have the necessary power when negotiating with publishers, so the right to mine is not overridden by contracts, and no additional information about the research is requested by publishers. And, as well, ensuring that any technical issues or access-blocking experienced by the institution are resolved quickly. Libraries pay for subscriptions to academic publications, there is no need to pay again to text and data mine contents already subscribed.

Furthermore, with a TDM exception libraries could, in short terms:

–       Perform TDM without requirement to inform or seek permission from publishers

–       Remove or ignore contractual provisions in licenses in conflict with TDM

–       Promote actions (including legal action) if access is blocked and not quickly resolved by the publisher

–       Protect personal data and privacy of researchers and other legitimate users from publisher requests for further information about TDM activities


  1. What is the best implementation you could hope for with these articles?

In short, our aspiration would be that the legal text allows the maximum use of text and data mining techniques for research purposes, and also to the legitimate users; with the only limitation that such uses do not conflict with a normal exploitation of the works and do not unreasonably prejudice the legitimate interests of the rightholders.

Specifically, we believe that there are a number of issues that it is important to incorporate or clarify in the law:

Data mining exception should allow acts affecting the right of transformation. It is not always clear when the use of these techniques can affect this right, so the express inclusion of this right would create legal certainty for researchers and legitimate users.

Public communication should also be allowed to enable researchers to carry out text and data mining activities where they have better tools for this, through a remote controlled system. That would prevent them from having to move, for example, to library facilities in order to analyse digitisations of their collections.

It should also ensure that the application of the exception entails the possibility of disseminating the results generated by it provided that such dissemination does not conflict with a normal exploitation of the work and does not unreasonably prejudice the legitimate interests of the author.

With regard to libraries and other cultural heritage institutions, the law should specify that they may use the exception of article 3 to conduct research in the context of their main activities. A restrictive interpretation of the concept of scientific research will make the exception useless for our institutions.

The storage of copies generated by the mining of text and data should be made where the researcher or the legitimate users choose, provided that they are protected against unauthorized access. Moreover, imposing different storage conditions in each European country may be an impediment to the development of cross-border projects.

It must be ensured also that, in the case of technological protection measures, the beneficiaries of the exception may have an extraordinary remedy requiring rightholders, or their intermediaries, to lift such mechanisms within a maximum of 72 hours, including financial penalties in case of non-compliance, where appropriate.

Since the exception (both exceptions of article 3 and 4) should not be subject to fair compensation, it should be ensured that suppliers of works and services do not impose a higher price on their subscription to enable text and data mining activities.

Finally, regarding specifically article 4, and according to the EU-DSM Directive, the law should also ensure that in cases of accessible resources that have been made publicly available online, rightholders can only object to the exception through the use of machine-readable means; otherwise the exception will become useless, as a manual review of terms of use and legal notices of websites cannot be intended.

  1. What is your government’s position on the issue?

We have no information about this aspect at the moment. The government launched a public consultation on December 2019 but they did not expose any kind of explanation or clarification on the positions of the government regarding the transposition of the EU-DSM. As far as we know (https://www.notion.so/Spain-64ff430a3fec4ed2a17895bd82ceb6e8), they will probably publish a draft of the legislative text when the State of Alarm ends.


Library Stat of the Week #17: Greater Numbers of Librarians Per Public Library Are Associated with More Equal Societies

Last week, in the first of a sub-series looking at library and equality data, we explored the connection between the number of public and community libraries in a country, and how equal it is according to the Gini Coefficient (an indicator of inequality used in the Development and Access to Information Report).

Crossing the data showed that, globally, countries that tended to have more public and community libraries per 100 000 were also characterised by greater equality (i.e. lower Gini Coefficients).

However, it does not make sense to stop at simply counting libraries. The role of librarians and other library workers is key, providing a whole range of services to users. Their presence is also an indicator of how much countries are investing in the operations of their library services, rather than just the sunk costs of buildings.

Fortunately, IFLA’s Library Map of the World also collects data for numbers of librarians and related staff in public and community libraries, allowing us to look at the connection.

As a first step, we can look at the relationship between the number of public and community librarians per 100 000 people, and the Gini Coefficient.

Graph 1: Public/Community Librarians Vs Gini Coefficient

As the graph indicates, more public and community library workers per 100 000 people tends to be associated with a lower Gini Coefficient, and so lower inequality.

We can say that for every seven more public and community library workers per 100 000 people (or 70 per million), a country sees a 1-point drop in inequality.

Similarly, the same drop is associated with three extra public or community libraries per 100 000 people (or 30 per million).

Graph 2: Public/Community Librarians vs Gini Coefficient (by Region)

A second step, as in the second graph, is to break this down by region. As with the figures last week, it is clear that European countries tend to enjoy both lower levels of inequality and higher numbers of librarians, while the inverse is true of Africa and Latin America and the Caribbean.

The final question then is whether having more or fewer public or community library workers makes a difference, once you take the number of libraries per head into account.

We can do this by looking at the relationship between having a greater or lesser degree of inequality than would be expected with a given number of public or community libraries, and having a greater or lesser than average number of public or community library workers.

Graph 3: Does More Librarians Mean More Equality, even after Controlling for Number of Libraries?

The third graph does this, comparing the level of equality compared to expectations on the X (horizontal) axis (calculated using the trend line in the first graph) with the number of librarians per library more or less than the average on the Y (vertical axis).

The key finding here is shown with the thick black line, which indicates that in general countries with more public and community library workers per library than average also score higher than expected for equality, while those with fewer workers score lower on equality.

The same finding applies in most work regions as well, with a particularly strong trend in Western and Central Europe, as well as Africa, Asia Oceania and the Middle East and North Africa, although is not reflected in North America (just two countries), Latin America and the Caribbean and Eastern Europe (Eurasia).

As always, correlation is not causality, and it is reasonable to assume that both higher levels of equality and higher numbers of librarians are both illustrative of societies that care more about fairness and inclusion.

Nonetheless, the indication of the connection between investment in libraries and more equal societies is a welcome one as governments reflect on how to build better societies post-COVID-19.

Next week, we’ll be looking at how data on numbers of libraries and librarians relates to levels of social mobility in societies.


Find out more on the Library Map of the World, where you can download key library data in order to carry out your own analysis! See our other Library Stats of the Week! We are happy to share the data that supported this analysis on request.