Last week, in the first of a sub-series looking at library and equality data, we explored the connection between the number of public and community libraries in a country, and how equal it is according to the Gini Coefficient (an indicator of inequality used in the Development and Access to Information Report).
Crossing the data showed that, globally, countries that tended to have more public and community libraries per 100 000 were also characterised by greater equality (i.e. lower Gini Coefficients).
However, it does not make sense to stop at simply counting libraries. The role of librarians and other library workers is key, providing a whole range of services to users. Their presence is also an indicator of how much countries are investing in the operations of their library services, rather than just the sunk costs of buildings.
Fortunately, IFLA’s Library Map of the World also collects data for numbers of librarians and related staff in public and community libraries, allowing us to look at the connection.
As a first step, we can look at the relationship between the number of public and community librarians per 100 000 people, and the Gini Coefficient.
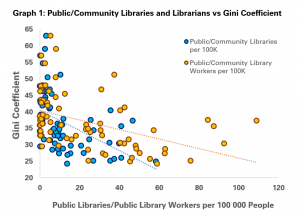
As the graph indicates, more public and community library workers per 100 000 people tends to be associated with a lower Gini Coefficient, and so lower inequality.
We can say that for every seven more public and community library workers per 100 000 people (or 70 per million), a country sees a 1-point drop in inequality.
Similarly, the same drop is associated with three extra public or community libraries per 100 000 people (or 30 per million).
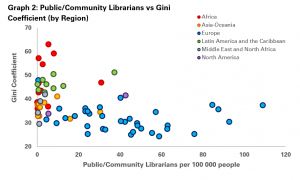
A second step, as in the second graph, is to break this down by region. As with the figures last week, it is clear that European countries tend to enjoy both lower levels of inequality and higher numbers of librarians, while the inverse is true of Africa and Latin America and the Caribbean.
The final question then is whether having more or fewer public or community library workers makes a difference, once you take the number of libraries per head into account.
We can do this by looking at the relationship between having a greater or lesser degree of inequality than would be expected with a given number of public or community libraries, and having a greater or lesser than average number of public or community library workers.
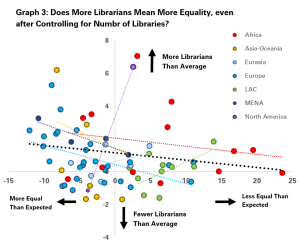
The third graph does this, comparing the level of equality compared to expectations on the X (horizontal) axis (calculated using the trend line in the first graph) with the number of librarians per library more or less than the average on the Y (vertical axis).
The key finding here is shown with the thick black line, which indicates that in general countries with more public and community library workers per library than average also score higher than expected for equality, while those with fewer workers score lower on equality.
The same finding applies in most work regions as well, with a particularly strong trend in Western and Central Europe, as well as Africa, Asia Oceania and the Middle East and North Africa, although is not reflected in North America (just two countries), Latin America and the Caribbean and Eastern Europe (Eurasia).
As always, correlation is not causality, and it is reasonable to assume that both higher levels of equality and higher numbers of librarians are both illustrative of societies that care more about fairness and inclusion.
Nonetheless, the indication of the connection between investment in libraries and more equal societies is a welcome one as governments reflect on how to build better societies post-COVID-19.
Next week, we’ll be looking at how data on numbers of libraries and librarians relates to levels of social mobility in societies.
Find out more on the Library Map of the World, where you can download key library data in order to carry out your own analysis! See our other Library Stats of the Week! We are happy to share the data that supported this analysis on request.