Libraries have an important function in societies in promoting equity.
For those who do not have the resources to access books or who cannot afford a strong internet connection or hardware, they are a free (or low-cost) alternative.
For those who could not benefit from a good education, they provide another route back into learning.
Increasingly, libraries have expanded services – consistent with their overall mission – to find other ways to help members of society at risk of information poverty.
Given this, it is worth trying to understand what we can learn from statistics about levels of inequality in the world, and how these relate to libraries, using data from the Library Map of the World.
This post – the first in a sub-series – looks at some initial indicators of the relationship between different indicators of inequality or income distribution and the presence of libraries in a country.
While this is certainly a proxy, we will use the number of public or community libraries per 100 000 people as a measure of how well served a population is.
To understand inequality, we can take two approaches – one of the standard measures of income inequality – the Gini Coefficient – and then the percentage of the population living under national poverty lines (both using World Bank figures).
These allow us both to get a sense of how income is distributed across a population in general (i.e. how ‘fair’ or ‘unfair’ it is), and then what share of the population struggles to survive from day to day.

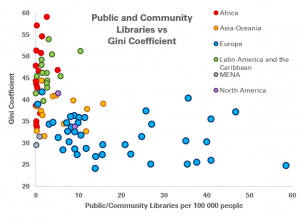
Looking at the Gini Coefficient first, as the above graph shows, there is generally an inverse relationship between the number of libraries per 100 000 people and the coefficient (a higher coefficient indicates higher inequality), indicating that the more libraries there are, the fairer a society is.
Interestingly, this relationship is less clear at the regional level, with the exceptions of North America and Europe, where there is a clear link (although obviously with North America, the sample size is small!). Globally, it becomes clear – sadly, that Africa and Latin America and the Caribbean seem to be characterised by both low numbers of public and community libraries (on the basis of the data we have) and higher levels of inequality.

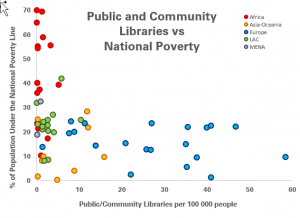
Turning to the share of the population under the national poverty line (see the graph above), there is a similar inverse relation between the number living in poverty, and the number of libraries per 100 000 people.
Again, this tendency is also reflected in Europe, where an extra 10 public or community libraries per 100 000 people is linked to a fall of 1.1 percentage point in the share of the population living in poverty.
Clearly, as ever, correlation is not necessarily causation. It is likely to be the case that societies that invest more in libraries also invest more in other measures to tackle inequality. In other words, more libraries can be a symptom of a more pro-equality stance, rather than the reason for this.
Nonetheless, it stands that more libraries remains linked to higher equality and lower poverty.
To explore further, given that different countries take different approaches to the number of libraries they have (fewer, bigger ones, or more, smaller ones), we’ll look at the links between the number of library workers and indicators of equality and poverty.
Find out more on the Library Map of the World, where you can download key library data in order to carry out your own analysis! See our other Library Stats of the Week! We are happy to share the data that supported this analysis on request.