Tag Archives: public libraries

The 15-Minute City: A Key Reference for Libraries?

An idea that has picked up a lot of attention in the last couple of years in urban development discussions has been that of the 15-Minute City.

The concept – or similar ones – have been around for a number of years, with Carlos Moreno often cited as the primary source, but was most prominently taken up by the Mayor of Paris, Anne Hidalgo, in her successful 2020 re-election campaign. Since then, a number of global organisations – including the C40 Cities network – have taken it up with enthusiasm, and it features near the top of The City We Need Now 2.0, a recent publication of the World Urban Campaign (see a future blog).

It provides a neat way of bringing together a lot of thinking about how to make cities more liveable into a single, understandable idea – that people should be able to do all of the essential things in their lives – shopping, eating, working, relaxing, learning – within a 15-minute walk or bicycle ride.

It stands in contrast to models of cities where people need to travel much longer distances – often by private transport – in order to fulfil these basic needs, leading not only to pollution and lost time, but also a sense of dislocation.

This is particularly the case in cities subject to sprawl (i.e. which spread over huge spaces) or with unmixed zoning (i.e. residential areas are kept separate from commercial or industrial ones). Too often, for example, distant suburbs or housing estates are the ones that experience the most serious problems. Many groups in such areas, for example, may simply be unable to travel long distances, for reasons of cost, disability, or simply lack of time.

Moreno himself, in his TED talk, sets out four underlying principles: 1) ecology – the idea that we need to be promoting ways of living that are better for the environment and nature, with more green spaces and less pollution; 2) proximity – the idea that key services (including culture) are close by; 3) social connection – that people benefit from knowing their neighbours and building stronger relations and collaborations, and 4) engagement – that people need to more closely involved in decision-making about their areas.

The library angle

As highlighted, while the term ’15-minute city’ may be new, it brings together existing ideas, including many which will be familiar to libraries. Indeed, the idea of libraries providing services in places that don’t require people to drive is already familiar from the IFLA Green Library Checklist.

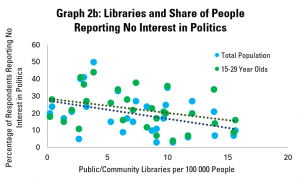
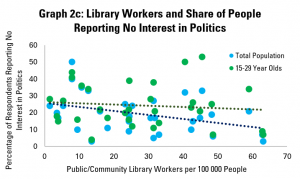
Firstly, there is the obvious role of networks of public and community libraries in providing services in proximity to their users. It is well understood that in order to respond to local needs, a key factor for success is being close enough to be able to understand these, and give everyone an opportunity to benefit. Protests against library closures often focus on the fact that forcing users to travel longer distances risk excluding them. It is a source of pride that libraries represent perhaps the densest network of cultural institutions that many cities or countries have.

A second angle is the idea of multi-functionality. 15-Minute City proponents argue that there needs to be better use of space, including flexibility to ensure that any one building or location can serve a number of purposes and publics. This is of course what libraries already do, acting as centres for culture, education, democracy, public health, and beyond. This is supported by libraries’ emphasis on responding to user needs, rather than trying to apply a rigid, one-size-fits-all service model. This is also something that libraries are developing, building on their role – often – as the only non-commercial indoor public space, with dedicated staff and internet access.

Strongly connected to the above is the emphasis on the social function of libraries as places not just for individual study or enjoyment (although this if of course important), but also for interaction. As highlighted, it is vital to have these opportunities outside of commercial locations or those that may be off-limits for different groups. Here too, libraries around the world are developing their capacity as meeting places, where social capital can be built and maintained. Through offering programming, rooms, access to shared cultural references, opening eyes to other cultures, or simply by allowing people to be together, they make the difference.

A further role of libraries, again linked to the above, is in boosting democracy. Collective decision-making of course starts with a feeling of belonging to the same community, and being able to talk, discuss, share, and work together to develop new ideas. As highlighted, libraries already enable this through their social function. However, they can go further, for example acting as centres for providing access to – and facilitating use of – local open data. They can be venues for consultations and conversations between decision-makers and citizens. And they can help fight misinformation by building the skills to evaluate and use information effectively.

Questions to address

Of course, the 15-minute city concept does raise questions, and indeed has its critiques, notably from those who suggest that without significant efforts, it tends to be richer areas and communities that benefit. For example, in Paris, the conversion of roads along the Seine in parks was seen as primarily benefitting the (better off) communities living there, at the expense of those living further away, and who rely on their cars to get to work.

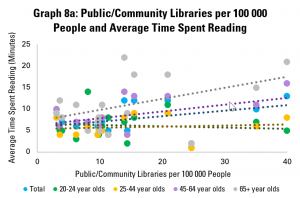
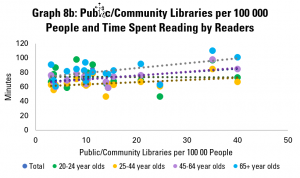
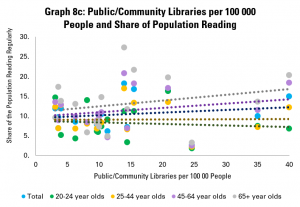
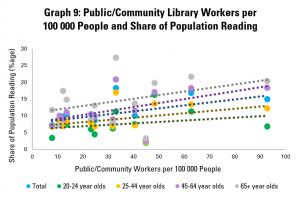
For libraries in particular, there is the question of how to manage the perceived trade off between scale and impact – is it better to have fewer, bigger institutions with more possibilities to offer services and programming, or more, smaller ones (for example, see the variation highlighted in our Library Stat of the Week post)?

Of course, this may be a false dichotomy. When working effectively as a network, smaller libraries can benefit from the advantages of scale, for example in access to collections. However, it is clearly also the case that offering a wide range of programming and activities with reduced space and staff is harder than for a big central library.

Connected to the critique of 15-minute cities mentioned above, there is a particular need to ensure that all communities – not just wealthier ones – benefit. This implies a need to invest more in library services in deprived areas.

This of course can have a major pay-off, given that it can be people facing poverty who can benefit most from library services, and who would otherwise not be able to travel longer distances to a bigger institution. However, it does of course require investment, and strong support for librarians so that they in turn can share have the greatest positive effect. This includes work within the library field to share ideas and resources, from the level of local networks of libraries, to the national and even the global level.

A powerful reference for library advocacy

The idea of a 15-Minute City has the potential to be a powerful one for libraries, given how far it plays to our institutions’ existing strengths. We can fit in well with urban development agendas that use it as a reference point, although of course may need to work to remind decision-makers that this is the case.

At the same time, it does raise questions that libraries will need to address, notably about how to ensure that all residents of towns and cities have reasonable access to libraries. Ideally, we can make the most of 15-minute city policies to ensure that our institutions – and profession – receive the investment and support needed to (continue) to make this a reality.

Cut, maintain or invest: three choices for library funders

While public libraries are often organised as a specific service within local or regional government, or at least linked to it, in reality they support delivery of priorities across the board.

There are countless stories of library staff receiving questions related to other policy areas, such as health or access to justice.  Similarly, many of the people coming to use library computers have been sent by other agencies – for example those working to provide employment support or benefits.

In responding to this demand – to the best of their ability – libraries provide an important complement to these other services, contributing to their effectiveness, in particular in reaching those most in need.

Yet, of course, the people working in libraries are information professionals, not health, legal or social care professionals. It can be daunting for library staff to face requests for information on questions which are hugely important for users, and over which they have little training.

This situation translates into three broad choices for those taking decisions for funding about public spending in general, and libraries in particular.

Option 1: Cut

The first option is to cut budgets. By reducing opening hours, cutting staff, and no longer investing in new equipment, library funders could claim to be saving money.

However, it is highly questionable that this will be the case. For a start, the communities for the benefit of which decision-makers are supposed to be acting lose a key public space and driver of the enjoyment of key rights. As set out in our interview with Christian Lauersen, these impacts can be as important as they are varied.

But, crucially, it no longer becomes feasible for other government offices and services to tell people to go to the library if they need help to get online, or to get support.

Employment agencies can no longer count on jobseekers being able to search for work online. Health services cannot rely on people being able to use telehealth, rather than needing to come to hospitals or general practitioners. Benefits agencies cannot expect that the people who they are supposed to serve will reach them. Individuals cannot access the information they need to understand – and so enforce – their rights.

This is a recipe for reducing the effectiveness of public services, and so their ability to promote growth and inclusion.

Option 2: Do nothing

The second option is to maintain budgets at similar levels to currently. This would allow libraries to continue to provide services as now, with library staff providing information within their means, and internet access within their resources.

Clearly, this can already have a positive impact, as testified to whenever a library professional is able to connect a user to the information they need.  However, there is arguably still unrealised potential when library staff do not have the support needed to maximise their effectiveness in helping users in different areas, and indeed face anxiety about whether they are even able to do so.

Moreover, as the consequences of the pandemic continue to be felt, the demand for the sort of public services highlighted in this piece seems likely to grow. With the shift to digital-only public services only likely to continue also, even sticking with the status quo could mean a less scope for libraries to deal with individual requests.

As such, doing nothing, while better than cuts, cannot be seen as particularly desirable.

Option 3: Invest

The final option then is to think about how additional support could help libraries achieve all that they should be able to, given their unique characteristics as a public, non-commercial space staffed by dedicated professionals.

For example, making resources available to support training or the hiring of professionals can be transformational in terms of helping libraries provide accurate and effective support to users.

Enhancing capacity to provide meaningful internet access – both through modern hardware and skilled staff support – can also make libraries far more powerful as an enabler of the success of any number of eGovernment and other digital services.

For example, the Australian Library and Information Association secured support to offer training to librarians in order to be able better to support users in engaging with a new digital health records service.

Also in Australia, and a little earlier, the Law and Justice Foundation of New South Wales recognised the value of upgrading libraries’ abilities to respond to legal questions, and so paid for the development of new training and materials.

Beyond projects supported by partners from other sectors, there are also of course projects driven by more dedicated library funders which can provide useful pilots to demonstrate what can be done also. Naturally, any such efforts do require libraries themselves to organise themselves in order to maximise their own impact.


Clearly, the coming years are likely to be times of difficult decisions around budgets. However, it will also be a period of intense need for effective public services in order to support recovery.

Faced with this need, there is a strong case for investing the relatively small amounts necessary to realise the potential of libraries to ensure that these services have the greatest impact and reach possible.

Library Stat of the Week #50 (Part 2): Where there are stronger and better used public and community libraries, more people read, more often

In the final post both of this mini-series on libraries and cultural data, and of our regular Library Stat of the Week posts, we return to a core function of libraries – to promote reading and access to books.

In the past three weeks, we have looked at data around how much households spend on books, as well as on wider data around participation in artistic and cultural activities. In each case, it appears that having more libraries, and using them better, is linked to greater spending and engagement.

This week, we look at data on how people spend their time, and in particular on how many people read regularly, and then how long they spend doing it.

For many, simply encouraging more reading is an end in itself, although of course this can also have positive impacts on issues such as wellbeing (a key issue during the pandemic!), literacy (skills can deteriorate if not used) and of course on the health of the wider cultural sector.

Once again, we are drawing on data from Eurostat, and in particular the Time Spent on Cultural Activities dataset (gathered between 2008 and 2015). Given its focus, it only covers countries in Europe, but offers insights that can apply elsewhere. As ever, data on libraries comes from the IFLA Library Map of the World, crossed with World Bank population data.

To set the scene, we can look already at what we know about people’s habits around reading, in particular throughout their lives.

Graph 7a: Average Time Spent Reading per Day Over Life

Graph 7a does this by looking at the average time spent reading per day per person, broken down by different age groups. It shows that, in general, there is a U-shaped curve, with people reading more when they are younger and when they are older, with 25-44 year olds reading least on average.

There are exceptions within this. For example, Romanian 15-20 year olds on average read more than any others in Europe. However, older Romanians (aged 65+) are the second least regular readers. Meanwhile, young Austrians and Dutch are low readers, but their parents and grandparents on average spend a much more average amount of time reading.

Graph 7b: Average Time Spent Reading by Readers Per Day

Graph 7b looks only at those people declaring that they do read regularly, and explores how long they spend doing this. While there is, again, a dip in average time spent reading among the 25-44 age group, this is less dramatic. Hungarian readers show up across all age groups as one of the nationalities that reads most when they do.

Graph 7c: Share of the Population Reading Books

The other driver of overall figures on how much people read on average is data about the share of the population reading at all. Graph 7c explores this, noting that the share of the population reading in general tends to be relatively stable, or drop between 15-20 and 25-44 year olds, and then rise relatively sharply among older groups. For example, while only an average share of younger Norwegians read, a larger share of older Norwegians than in any other country covered read. Similarly, from coming almost bottom of the class among younger groups, the older Dutch and Austrians come around average when it comes to the share of older people reading.

Graph 7d: Reading Intensity and Extensiveness

We can get an overview of the extensiveness (i.e. share of the overall population reading) and intensity (time spend reading by those who do) in Graph 7d, which looks at populations as a whole.

This shows us that Finland, Poland and Estonia do not just have an above average share of readers in the population, but those who do read tend to do so for longer. In contrast, Italy, France, Austria, the Netherlands, Belgium and the United Kingdom have both a below-average share of readers in the population, and those who do read do so for shorter times than average.

Finally, there is a contrast between Norway, Luxembourg and Germany (more readers, but reading for shorter times), and Spain, Serbia and Romania (fewer readers, but those who do read for longer). A separate analysis of the situation for different age groups could also be interesting here, in order to understand whether the main challenge in increasing reading is to allow more time for this, or to get more people reading in the first place.


Having looked at reading habits, it is now time to look at the relationship between libraries and reading.

Graph 8a: Public/Community Libraries per 100 000 People and Average Time Spent Reading

Graph 8a looks at the availability of public and community libraries, as measured by the number of libraries per 100 000 people, compared to the average time spent reading by different age groups. It finds that there is a positive correlation for the population as a whole, mainly driven by older readers (those aged 45-64 and 65+). The link is less obvious for younger readers (aged 20-24 and 25-44).

Graph 8b: Public/Community Libraries per 100 000 People and Time Spent Reading by Readers

Graph 8b looks at the amount of time spent reading by those who do read. This again shows a gentle, but positive correlation – in other words, in countries with more public and community libraries, those people who do read tend to spend more time doing so. Looking across age groups, the correlation is positive for all, although only slightly in the case of 20-24 year olds.

Graph 8c: Public/Community Libraries per 100 000 People and Share of Population Reading

Graph 8c looks at numbers of public and community libraries, and the share of the population in different age groups reading. Again, it finds weak but positive correlation between numbers of libraries and tendency to read, with stronger links for older groups. The picture is similar if we look only at countries with up to 20 public or community libraries per 100 000 people.

Overall, the story from this is that pure numbers of libraries are positively linked with how many people read, and how much they do, but not particularly strongly.

Graph 9: Public/Community Library Workers per  100 000 People and Share of Population Reading

Graph 9 goes a little further, looking rather at numbers of public and community library workers. This is, arguably, a stronger indicator of how much is being invested in the library field, as well as its ability to reach out to readers, welcome them, and support literacy.

This shows a more positive link between the strength of the library field and share of adults reading, with an increase of 10 library workers per 100 000 people tending to be linked to a rise of 1% in the share of the population reading (or 1000 people). This arguably makes sense – library staff have a key role in helping readers find books that interest them, and simply in making libraries into welcoming places.

Once again, the connection is stronger in older groups. Interestingly, it does not appear that those who do read spend more time doing so in countries with more public and community library workers.

Graph 10a: Library Visits per Person and Average Time Spent Reading

Yet as in previous posts, the strength of the library field is only part of the picture – so too is how well it is used. Graph 10a does this, using data on average library visits per person per year. It shows a positive correlation between library visits and the length of time adults in general spend on reading per year, again with more positive links among older groups.

Graph 10b: Library Visits per Person and Time Spent Reading by Readers

Graph 10b looks at how long those adults who read do so on average. Here, the picture is similar to that in Graph 8b, with a weakly positive correlation. Again, it appears that there is little link between libraries and how long people spend reading.

Graph 10c: Library Visits per Person and Share of Population Reading

Graph 10c however looks at the share of the adult population that reads, and once again displays a strong and positive correlation. Across the population as a whole, an increase of one library visit per person per year tends to be associated with a 1.28 percentage point rise in the share of the population reading.

Graph 11: Library Loans per Person and Share of the Population Reading

Graph 11 repeats this last analysis, but with the average number of loans from public and community libraries per person per year. Again, there is a relatively strong positive correlation, with an extra library loan per person per year associated with a 0.6 point rise in the share of adults reading. As in Graph 10c, the connection holds for all age groups, although is stronger for older ones.


What can we conclude from this? First of all, that there are significant differences in reading habits across the European countries surveyed by Eurostat. High performance – as measured by a high average length of time spent reading per person – can be influenced by the number of people reading, and how long they read for. This performance matters, given the role of reading in maintaining and strengthening skills, in promoting wellbeing, and in providing demand for writing.

Looking at the connections with libraries, it seems that there are much stronger links between libraries and the share of the population reading than between libraries and how long people spend reading.

While correlation is not causality, the data shared here would support the argument that libraries can play a role in getting more people reading, and so in helping more people benefit in terms of skills and wellbeing. In particular, numbers of library staff appear to matter more than numbers of libraries, and levels of use of libraries have a stronger link still.

This would imply that a key focus of governments looking to boost reading will likely be to ensure that libraries are well-staffed and welcoming for all.

Throughout, the relationship between public and community libraries and numbers of people reading seems weakest in general for younger groups. To some extent, this may be because many younger people have access to university libraries (in the case of 20-24 year olds in particular), or just because of less inclination to read in general among 25-44 year olds. It can also be underlined that the importance of reading for skills is more important among older groups in any case.

Nonetheless, this does raise interesting questions about whether more can be done to increase reading among 25-44 year olds, and whether libraries can strengthen their role in this.


Find out more on the Library Map of the World, where you can download key library data in order to carry out your own analysis! See our other Library Stats of the Week! We are happy to share the data that supported this analysis on request.

Library Stat of the Week #49: Faced with Competition from Online Entertainment, Household Spending on Books Has Held Up Better Where Libraries are Stronger

In a three-part series to end our regular #LibraryStatOfTheWeek posts, we are looking at data around culture, and crossing this with information gathered by IFLA through the Library Map of the World.

Last week’s post – the first of the mini-series – therefore looked at the link between the strength of library fields (including how well used they are), and the share of household spending on culture that is dedicated to books.

This is a helpful indicator, especially in a digital age where different activities are competing for our free time and resources. Given that overall tendencies to spend on culture will be determined by a variety of external factors (earnings and disposable incomes for example), this can even be a more meaningful way of understanding the place of reading – and books – in societies.

Libraries themselves have an important role in promoting reading, both in terms of helping adults discover new works, and in ensuring that coming generations turn into capable and confident readers.

This week, we look beyond the figures for one year (2015), and rather at evolutions in spending between the two years for which data is available – 2010 and 2015. This allows us to see how well spending on books, as a share of overall household cultural spending, has fared at a time that new online cultural activities were emerging.

Once again, data on household cultural spending comes from Eurostat (and so focuses only on European countres), while data on libraries and use comes from the IFLA Library Map of the World (latest available year), crossed with population data from the World Bank in order to obtain per capita figures. In each of the analyses noted below, we have only included a country when all relevant data was available.

Graph 1: Public/Community Libraries per 100 000 People and Change in Share of Household Cultural Spending on Books

Graph 1 starts by comparing numbers of public and community libraries per 100 000 people with the change in the share of household cultural spending going on books between 2010 and 2015.

In the graph, each dot represents a country. The higher it is, the more positive the change in share of spending has been. The further to the right it is, the more libraries there are per 100 000 people.

It is worth noting that, in all countries covered by this data, the share of household cultural spending going on books has fallen. This makes sense, given the points set out above concerning the rise of online entertainment.

The graph indicates that, in general, countries with higher numbers of public and community libraries per 100 000 people have tended to see smaller falls in the share of cultural spending going on books.

Graph 2: Public/Community Library Workers per 100 000 People and Change in Share of Household Cultural Spending on Books

Graph 2 looks rather at numbers of public and community library workers per 100 000 people. Dots further to the right on this graph therefore indicate countries with a higher number of such workers.

Here too, the story is positive – where there are more public and community library workers, in general, falls in the share of household cultural spending going on books have been lower. In other words, book sales have resisted better to competition where libraries are stronger.

Graph 3: Public/Community Visits per Capita and Change in Share of Household Cultural Spending on Books

Graph 3 looks at numbers of visits per person to public and community libraries. This shows a relatively strong, positive correlation between library use and changes in the share of household cultural spending going on books.

This tallies with the finding last week that library visits, in particular, seem to be well-connected to the economic situation of the book sector. This makes sense – libraries can be important shop-windows, and of course also build enthusiasm for reading.

Graph 4: Library Book Loans per Capita and Change in Share of Household Cultural Spending on Books

Graph 4 looks at average numbers of book loans per capita. Again, there is a positive correlation – and indeed a stronger and more positive one than in the graph last week looking at spending in just one year.

In other words, library lending tends to be associated with better performance over time for the book sector.

Graph 5: Change in Share of Household Cultural Spending on Books and Share of Registered Library Users in the Population

Graph 5, finally, looks at connections between numbers of registered library card holders (calculated as a share of the population), and trends in the share of books in total household cultural spending.

This again shows a positive correlation, although a less strong one, although partly driven by the result for Spain, where there is a high rate of library card holding, but also a big fall in spending on books as a share of overall cultural spending.


Overall, these figures provide further helpful support for advocacy around the value of our institutions in supporting a healthy book sector.

While correlation does not mean causality, it is possible to show that, far from greater library use being associated with lost tales, it is rather the opposite. These figures can be used in arguments to show that cuts to libraries – for example making it more difficult to visit and borrow – could be harmful to the book sector as a whole.


Find out more on the Library Map of the World, where you can download key library data in order to carry out your own analysis! See our other Library Stats of the Week! We are happy to share the data that supported this analysis on request.

Library Stat of the Week #48: In Countries with Stronger – and Better Used – Public and Community Library Fields, Books Account for Larger Shares of Household Spending on Culture

After a couple of weeks’ break, we’re back with a final mini-series of Library Stat of the Week posts, focusing this time on libraries and cultural data.

Cultural data itself is unfortunately not as widely collected as other types of data, partly because of a lack of widely adopted shared standards,  partly because – wrongly, we would suggest – it is not always a priority for statistical offices.

Fortunately, within the European Union, there is an effort to collect relevant information, looking at key questions such as how much households and governments are spending on culture, and how much people are benefitting from it.

Therefore, to close out our weekly series of library statistics posts, we are crossing data from the European Union’s Eurostat agency with data from IFLA’s Library Map of the World and the World Bank.

In this week’s post, we will look at the relationship between different public and community library indicators, and the share of total spending on cultural goods and services that goes on books.

The indicator of the share of total spending on books is useful, as it allows us to control for overall spending on culture in the population, which can vary strongly.

It also allows us to account for the fact that, arguably, different forms of culture are competing for our attention and available budgets. In other words, we can look at whether a stronger library field means that books ‘capture’ a larger share of cultural spending, a point that will be of interest, in particular to publishers and others in the book chain.

Data on spending on cultural goods and services comes from Eurostat’s database on mean expenditure by households on different goods and services. Data comes from 2015. Data on libraries comes from the Library Map of the World (most recent year), with World Bank population data (2018) used to allow us to calculate per capita figures.

As such, it is important to note that all data comes from European countries, but still allows for a look across a range of different library fields, and so can be useful for wider advocacy.

Graph 1: Public/Community Libraries per 100K People and Share of Cultural Spending on Books

Graph 1 starts by looking at shares of spending on books in total cultural spending in comparison with numbers of public and community libraries per capita.

In the graph, each point represents one country. The further to the right a point is, the more public and community libraries there are per 100 000 people, and the first up it is, the higher the share of books in overall household spending on cultural goods and services.

Looking at numbers of libraries gives an idea of how readily accessible libraries are to people, although of course does allow us to understand how well-supported each library is.

Overall, it appears then that there is a slight but small positive correlation between numbers of libraries and share of cultural spending on books.

Graph 2: Public/Community Library Workers per 100K People and Share of Cultural Spending on Books

Graph 2 looks at numbers of public and community library workers (full-time equivalents), arguably a stronger indicator of the strength of library fields.

This shows a slightly stronger, slightly more positive correlation, suggesting that where there are more public and community library workers, books account for a greater share of household spending on cultural goods and spending.

However, in addition to looking at ‘inputs’ to a strong library field (i.e. number of libraries and staff), we can also look to understand how well they are used. Library Map of the World data on numbers of visits, loans and registered users can help in this regard.

Graph 3: Visits to Public/Community Libraries per Person and Share of Cultural Spending on Books

Graph 3 therefore compares the average number of visits to public and community libraries per person per year with data on the share of household spending on cultural goods and services that goes on books.

This shows a stronger and more positive correlation still between use of libraries and spending on books. This would certainly vindicate the idea that libraries serve as venues for discovery of books, and so drive sales.

Graph 4: Average Book Loans per Person and Share of Cultural Spending on Books

Graph 4 repeats the exercise for loans of books. Once again, there is a positive correlation, although this is slightly less strong than for visits to libraries.

The fact that the connection is positive is nonetheless encouraging. Importantly, it is not negative!

Graph 5: Share of Population Registered at a Library and Share of Cultural Spending on Books

Finally, graph 5 looks at the share of the population that is a registered library user. Once again, the correlation is positive, but slightly less strong than for the numbers of visits.

The weaker connection here could perhaps be associated with the fact that simply being registered is only a proxy for intensity of library use.


As ever, correlation does not mean causality, and so we cannot necessary say that stronger – and better used – public and community library fields mean that books account for a greater share of household cultural spending.

Nonetheless, they do show that the two often come together. In particular, the strongest connections appear to be with the most meaningful indicators of library use – visits and loans.

This data is therefore a useful reference in advocacy around libraries contributing to, rather than holding back, the economic success of the book sector.


Find out more on the Library Map of the World, where you can download key library data in order to carry out your own analysis! See our other Library Stats of the Week! We are happy to share the data that supported this analysis on request.

The IFLA-UNESCO Public Library Manifesto: Past and Future Action

This month, we are celebrating the 26th Anniversary of the IFLA-UNESCO Public Library Manifesto. Since 1994, the Manifesto has been at the heart of public library advocacy – declaring UNESCO’s belief in the public library as a living force for education, culture and information, and its essential role in the promotion of peace and well-being.

Here is a look back at how librarians around the world have used the Manifesto, and a glimpse into what is coming next for this important document.

The Manifesto at Work

Earlier in 2020, IFLA’s Public Library Section launched a global survey to gather feedback from public libraries on the Manifesto, and how they have used it in their advocacy.

With over 600 responses, this was an extremely insightful look into how libraries around the world apply the Manifesto to their work.

39% of respondents said they have actively used the Manifesto to advocate and lobby for their library.

Of those who responded in the negative, the most prevalent reason given was that they have not yet had an opportunity or were not included in relevant conversations with decision-makers.

Survey participants were asked to share examples of the Manifesto being used in their library’s advocacy or operations.

Some excellent examples include:

  • using the Manifesto to power campaigns during National Library Week
  • referring to the Manifesto in strategic materials and in lobbying
  • featuring the Manifesto in negotiations with local city council and elected officials
  • using the Manifesto as a basis to create library activities
  • guiding funding decisions and budget
  • informing the selection of books and services provided by the library

IFLA would like to help public libraries around the world better use the Public Library Manifesto in advocacy. From this survey, we have learned that increased awareness-raising about the Manifesto in the future may help empower more librarians to put it to use in their advocacy.

For more on how the Manifesto has been put into action, refer to the IFLA Research Paper: Inspire, Inform, Indicate: How the UNESCO-IFLA Public Library Manifesto Makes a Difference.

For more ideas on how the Public Library Manifesto can be used in advocacy, please see our Advocacy Pack for Libraries and Library Associations.

The Manifesto in the Future

Another key development towards increasing the impact of the Public Library Manifesto is ensuring that it remains relevant to the work of libraries today.

Therefore, UNESCO, with the help of IFLA’s Public Library Section, is planning to update the Public Library Manifesto in the coming year. The goal of this revision will be to address the ever-evolving role of public libraries in their communities, while also acknowledging the substantial technological advances that have changed how many people access, create, and consume information.

The survey also plays a major role in this work – ensuring that the voice of the global library field is considered in the review process.

Here is a look at some ideas submitted by librarians on how to improve the UNESCO Public Library Manifesto for the future.

How can the Manifesto better reflect the missions of public libraries today?

  • Emphasize the role of libraries in the information society, such as highlighting the importance of Media and Information Literacy skills.
  • Expand the definition of lifelong learning
  • Reinforce the relationship between the library and the community
  • Increase mention of the importance of inclusivity, especially relating to marginalized communities

How can the Manifesto provide better guidance to decision-makers?

  • Highlight the importance of local knowledge
  • Promote participatory decision-making, both with library professionals and with communities
  • Appeal for sufficient human and material resources, which are required for libraries to fulfil their mission.
  • Link culture to the social and economic life of the community
  • Emphasize social impacts, and the fact that they are usually seen most clearly in subsequent generations

Next Steps

These suggestions, and all the others received during the surveying process, will be taken into consideration by the Public Library Section during the drafting of the Manifesto update. This is projected to be completed in 2021.

The significance of the Public Library Manifesto is that it has codified the exceptional value that public libraries have in their communities. By working to keep it relevant, reflecting the mission of public libraries today, we can ensure it remains a powerful tool for advocacy.

Together with UNESCO, IFLA is looking forward to delivering an updated Manifesto that can continue to support public librarians the world over in their essential work.

Library Stat of the Week #46: Where there are more libraries and librarians, people tend to be readier to engage in volunteering and more interested in politics

Last week’s Library Stat of the Week looked at the relationship between the strength of the library field in any given country, and levels of trust in government.

As highlighted, trust matters because it can be a determining factor in the effectiveness of policies, especially at the time of COVID-19.

This week we look to extend this analysis to indicators of the strength of civic life – i.e. the degree to which people are involved in the lives of their communities.

One way of looking at this is to look at the share of adults involved in formal volunteering opportunities. This can be a way of understanding how invested people are in helping others and improving their environment – i.e. mobilising energies to make for better lives. Data about this is available from the OECD’s Better Life Index.

Data on libraries comes from IFLA’s Library Map of the World.

Another is to look at democratic participation. Figures for participation in elections can tend to be skewed by the existence of obligatory voting, but information is available about levels of engagement, or at least of disengagement. Data on this can be found in the OECD’s Society at a Glance.

Graph 1a looks starts by looking at levels of volunteering across countries.

Graph 1a: Participation in Formal Volunteering

This indicates a high level of variation, with the United States, New Zealand, Norway, the Netherlands and Canada having the highest levels, with over a quarter of adults volunteering regularly. The lowest share is in Lithuania, at 4.2%.

Graph 1b: Public/Community Libraries and Library Workers per 100K People and Participation in Formal Volunteering

Graph 1b then compares this with the numbers of public and community libraries per 100 000 people. As last week, we have focused on countries with up to 20 public or community libraries per 100 000 people, and up to 70 public or community library workers per 100 000 people. This represents the large majority of countries, and avoids distortion from outliers.

This indicates that there is a generally positive correlation between the strength of library fields and prevalence of volunteering. While of course correlation is not causality, it fits with the idea of libraries as both catalysts and symbols of social and civic engagement.

Graph 2a: Share of the Population Uninterested in Politics

Turning to the question of levels of interest and engagement in politics, Graph 2a gives an idea of the share of the population in surveyed countries declaring that they have no interest in the subject.

This indicates that in most countries, young people (aged 15-29) tend to demonstrate higher levels of lack of interest in politics. The highest overall levels of lack of interest in the population as a whole are in Brazil, Chile and Colombia (all at 40% or more), while amongst younger people, it is Lithuania, the Czech Republic and Hungary that see the highest numbers of people declaring that they are not interested (50% or more).

Graph 2b: Libraries and Share of People Reporting No Interest in Politics

Graph 2b then compares these figures with the numbers of public and community libraries per 100 000 people. As before, we have focused on countries with up to 20 public or community libraries per 100 000 people, and up to 70 public or community library workers per 100 000 people.

This indicates that, in general, countries with more libraries tend to have smaller shares of people (both in general, and younger adults) declaring that they have no interest in politics at all. The relationship is slightly weaker with younger adults than with the adult population as a whole.

Graph 2c: Library Workers and Share of People Reporting No Interest in Politics

Graph 2c performs the same analysis with numbers of public and community library workers. Again, there is some correlation, with more library workers tending to be associated with lower numbers declaring no interest in politics.

As with volunteering, correlation does not mean causality, but would fit with the idea that libraries can support a greater feeling of community, and so engagement in decision-making.


Overall, the analysis presented in this post should support arguments that a stronger public and community library field is associated with stronger social and civic life, delivering both on SDGs 11 and 16.


Find out more on the Library Map of the World, where you can download key library data in order to carry out your own analysis! See our other Library Stats of the Week! We are happy to share the data that supported this analysis on request.