Tag Archives: public library

Library Stat of the Week #50 (Part 2): Where there are stronger and better used public and community libraries, more people read, more often

In the final post both of this mini-series on libraries and cultural data, and of our regular Library Stat of the Week posts, we return to a core function of libraries – to promote reading and access to books.

In the past three weeks, we have looked at data around how much households spend on books, as well as on wider data around participation in artistic and cultural activities. In each case, it appears that having more libraries, and using them better, is linked to greater spending and engagement.

This week, we look at data on how people spend their time, and in particular on how many people read regularly, and then how long they spend doing it.

For many, simply encouraging more reading is an end in itself, although of course this can also have positive impacts on issues such as wellbeing (a key issue during the pandemic!), literacy (skills can deteriorate if not used) and of course on the health of the wider cultural sector.

Once again, we are drawing on data from Eurostat, and in particular the Time Spent on Cultural Activities dataset (gathered between 2008 and 2015). Given its focus, it only covers countries in Europe, but offers insights that can apply elsewhere. As ever, data on libraries comes from the IFLA Library Map of the World, crossed with World Bank population data.

To set the scene, we can look already at what we know about people’s habits around reading, in particular throughout their lives.
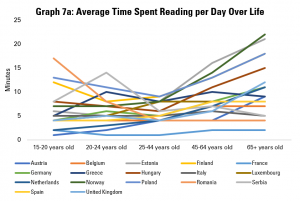
Graph 7a: Average Time Spent Reading per Day Over Life

Graph 7a does this by looking at the average time spent reading per day per person, broken down by different age groups. It shows that, in general, there is a U-shaped curve, with people reading more when they are younger and when they are older, with 25-44 year olds reading least on average.

There are exceptions within this. For example, Romanian 15-20 year olds on average read more than any others in Europe. However, older Romanians (aged 65+) are the second least regular readers. Meanwhile, young Austrians and Dutch are low readers, but their parents and grandparents on average spend a much more average amount of time reading.
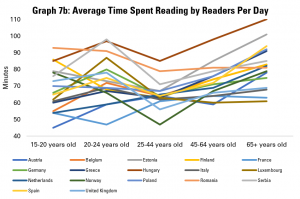
Graph 7b: Average Time Spent Reading by Readers Per Day

Graph 7b looks only at those people declaring that they do read regularly, and explores how long they spend doing this. While there is, again, a dip in average time spent reading among the 25-44 age group, this is less dramatic. Hungarian readers show up across all age groups as one of the nationalities that reads most when they do.
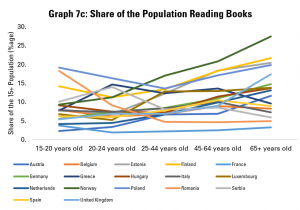
Graph 7c: Share of the Population Reading Books

The other driver of overall figures on how much people read on average is data about the share of the population reading at all. Graph 7c explores this, noting that the share of the population reading in general tends to be relatively stable, or drop between 15-20 and 25-44 year olds, and then rise relatively sharply among older groups. For example, while only an average share of younger Norwegians read, a larger share of older Norwegians than in any other country covered read. Similarly, from coming almost bottom of the class among younger groups, the older Dutch and Austrians come around average when it comes to the share of older people reading.
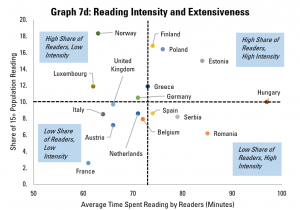
Graph 7d: Reading Intensity and Extensiveness

We can get an overview of the extensiveness (i.e. share of the overall population reading) and intensity (time spend reading by those who do) in Graph 7d, which looks at populations as a whole.

This shows us that Finland, Poland and Estonia do not just have an above average share of readers in the population, but those who do read tend to do so for longer. In contrast, Italy, France, Austria, the Netherlands, Belgium and the United Kingdom have both a below-average share of readers in the population, and those who do read do so for shorter times than average.

Finally, there is a contrast between Norway, Luxembourg and Germany (more readers, but reading for shorter times), and Spain, Serbia and Romania (fewer readers, but those who do read for longer). A separate analysis of the situation for different age groups could also be interesting here, in order to understand whether the main challenge in increasing reading is to allow more time for this, or to get more people reading in the first place.


Having looked at reading habits, it is now time to look at the relationship between libraries and reading.
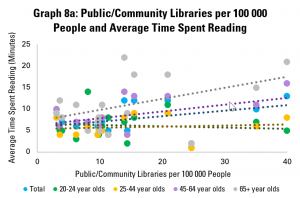
Graph 8a: Public/Community Libraries per 100 000 People and Average Time Spent Reading

Graph 8a looks at the availability of public and community libraries, as measured by the number of libraries per 100 000 people, compared to the average time spent reading by different age groups. It finds that there is a positive correlation for the population as a whole, mainly driven by older readers (those aged 45-64 and 65+). The link is less obvious for younger readers (aged 20-24 and 25-44).
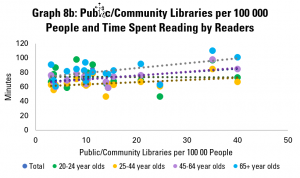
Graph 8b: Public/Community Libraries per 100 000 People and Time Spent Reading by Readers

Graph 8b looks at the amount of time spent reading by those who do read. This again shows a gentle, but positive correlation – in other words, in countries with more public and community libraries, those people who do read tend to spend more time doing so. Looking across age groups, the correlation is positive for all, although only slightly in the case of 20-24 year olds.
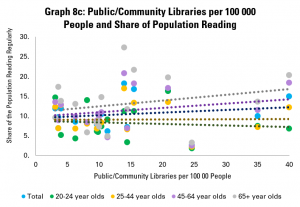
Graph 8c: Public/Community Libraries per 100 000 People and Share of Population Reading

Graph 8c looks at numbers of public and community libraries, and the share of the population in different age groups reading. Again, it finds weak but positive correlation between numbers of libraries and tendency to read, with stronger links for older groups. The picture is similar if we look only at countries with up to 20 public or community libraries per 100 000 people.

Overall, the story from this is that pure numbers of libraries are positively linked with how many people read, and how much they do, but not particularly strongly.
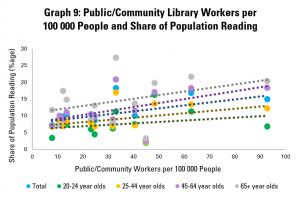
Graph 9: Public/Community Library Workers per  100 000 People and Share of Population Reading

Graph 9 goes a little further, looking rather at numbers of public and community library workers. This is, arguably, a stronger indicator of how much is being invested in the library field, as well as its ability to reach out to readers, welcome them, and support literacy.

This shows a more positive link between the strength of the library field and share of adults reading, with an increase of 10 library workers per 100 000 people tending to be linked to a rise of 1% in the share of the population reading (or 1000 people). This arguably makes sense – library staff have a key role in helping readers find books that interest them, and simply in making libraries into welcoming places.

Once again, the connection is stronger in older groups. Interestingly, it does not appear that those who do read spend more time doing so in countries with more public and community library workers.
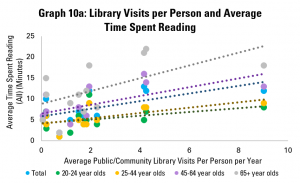
Graph 10a: Library Visits per Person and Average Time Spent Reading

Yet as in previous posts, the strength of the library field is only part of the picture – so too is how well it is used. Graph 10a does this, using data on average library visits per person per year. It shows a positive correlation between library visits and the length of time adults in general spend on reading per year, again with more positive links among older groups.
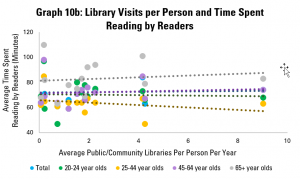
Graph 10b: Library Visits per Person and Time Spent Reading by Readers

Graph 10b looks at how long those adults who read do so on average. Here, the picture is similar to that in Graph 8b, with a weakly positive correlation. Again, it appears that there is little link between libraries and how long people spend reading.
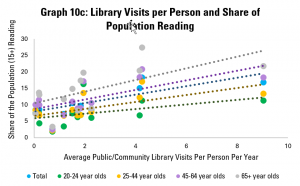
Graph 10c: Library Visits per Person and Share of Population Reading

Graph 10c however looks at the share of the adult population that reads, and once again displays a strong and positive correlation. Across the population as a whole, an increase of one library visit per person per year tends to be associated with a 1.28 percentage point rise in the share of the population reading.
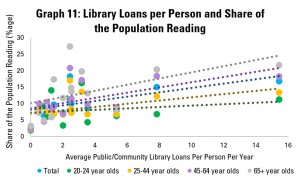
Graph 11: Library Loans per Person and Share of the Population Reading

Graph 11 repeats this last analysis, but with the average number of loans from public and community libraries per person per year. Again, there is a relatively strong positive correlation, with an extra library loan per person per year associated with a 0.6 point rise in the share of adults reading. As in Graph 10c, the connection holds for all age groups, although is stronger for older ones.


What can we conclude from this? First of all, that there are significant differences in reading habits across the European countries surveyed by Eurostat. High performance – as measured by a high average length of time spent reading per person – can be influenced by the number of people reading, and how long they read for. This performance matters, given the role of reading in maintaining and strengthening skills, in promoting wellbeing, and in providing demand for writing.

Looking at the connections with libraries, it seems that there are much stronger links between libraries and the share of the population reading than between libraries and how long people spend reading.

While correlation is not causality, the data shared here would support the argument that libraries can play a role in getting more people reading, and so in helping more people benefit in terms of skills and wellbeing. In particular, numbers of library staff appear to matter more than numbers of libraries, and levels of use of libraries have a stronger link still.

This would imply that a key focus of governments looking to boost reading will likely be to ensure that libraries are well-staffed and welcoming for all.

Throughout, the relationship between public and community libraries and numbers of people reading seems weakest in general for younger groups. To some extent, this may be because many younger people have access to university libraries (in the case of 20-24 year olds in particular), or just because of less inclination to read in general among 25-44 year olds. It can also be underlined that the importance of reading for skills is more important among older groups in any case.

Nonetheless, this does raise interesting questions about whether more can be done to increase reading among 25-44 year olds, and whether libraries can strengthen their role in this.


Find out more on the Library Map of the World, where you can download key library data in order to carry out your own analysis! See our other Library Stats of the Week! We are happy to share the data that supported this analysis on request.

Library Stat of the Week #49: Faced with Competition from Online Entertainment, Household Spending on Books Has Held Up Better Where Libraries are Stronger

In a three-part series to end our regular #LibraryStatOfTheWeek posts, we are looking at data around culture, and crossing this with information gathered by IFLA through the Library Map of the World.

Last week’s post – the first of the mini-series – therefore looked at the link between the strength of library fields (including how well used they are), and the share of household spending on culture that is dedicated to books.

This is a helpful indicator, especially in a digital age where different activities are competing for our free time and resources. Given that overall tendencies to spend on culture will be determined by a variety of external factors (earnings and disposable incomes for example), this can even be a more meaningful way of understanding the place of reading – and books – in societies.

Libraries themselves have an important role in promoting reading, both in terms of helping adults discover new works, and in ensuring that coming generations turn into capable and confident readers.

This week, we look beyond the figures for one year (2015), and rather at evolutions in spending between the two years for which data is available – 2010 and 2015. This allows us to see how well spending on books, as a share of overall household cultural spending, has fared at a time that new online cultural activities were emerging.

Once again, data on household cultural spending comes from Eurostat (and so focuses only on European countres), while data on libraries and use comes from the IFLA Library Map of the World (latest available year), crossed with population data from the World Bank in order to obtain per capita figures. In each of the analyses noted below, we have only included a country when all relevant data was available.

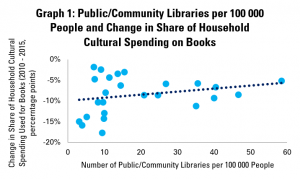
Graph 1: Public/Community Libraries per 100 000 People and Change in Share of Household Cultural Spending on Books

Graph 1 starts by comparing numbers of public and community libraries per 100 000 people with the change in the share of household cultural spending going on books between 2010 and 2015.

In the graph, each dot represents a country. The higher it is, the more positive the change in share of spending has been. The further to the right it is, the more libraries there are per 100 000 people.

It is worth noting that, in all countries covered by this data, the share of household cultural spending going on books has fallen. This makes sense, given the points set out above concerning the rise of online entertainment.

The graph indicates that, in general, countries with higher numbers of public and community libraries per 100 000 people have tended to see smaller falls in the share of cultural spending going on books.

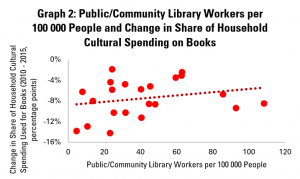
Graph 2: Public/Community Library Workers per 100 000 People and Change in Share of Household Cultural Spending on Books

Graph 2 looks rather at numbers of public and community library workers per 100 000 people. Dots further to the right on this graph therefore indicate countries with a higher number of such workers.

Here too, the story is positive – where there are more public and community library workers, in general, falls in the share of household cultural spending going on books have been lower. In other words, book sales have resisted better to competition where libraries are stronger.

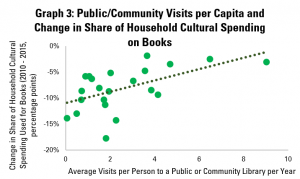
Graph 3: Public/Community Visits per Capita and Change in Share of Household Cultural Spending on Books

Graph 3 looks at numbers of visits per person to public and community libraries. This shows a relatively strong, positive correlation between library use and changes in the share of household cultural spending going on books.

This tallies with the finding last week that library visits, in particular, seem to be well-connected to the economic situation of the book sector. This makes sense – libraries can be important shop-windows, and of course also build enthusiasm for reading.

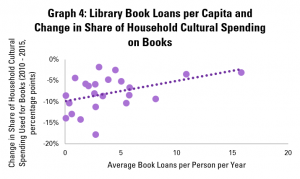
Graph 4: Library Book Loans per Capita and Change in Share of Household Cultural Spending on Books

Graph 4 looks at average numbers of book loans per capita. Again, there is a positive correlation – and indeed a stronger and more positive one than in the graph last week looking at spending in just one year.

In other words, library lending tends to be associated with better performance over time for the book sector.

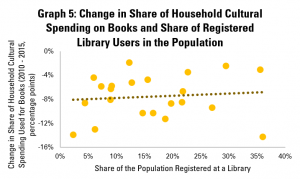
Graph 5: Change in Share of Household Cultural Spending on Books and Share of Registered Library Users in the Population

Graph 5, finally, looks at connections between numbers of registered library card holders (calculated as a share of the population), and trends in the share of books in total household cultural spending.

This again shows a positive correlation, although a less strong one, although partly driven by the result for Spain, where there is a high rate of library card holding, but also a big fall in spending on books as a share of overall cultural spending.


Overall, these figures provide further helpful support for advocacy around the value of our institutions in supporting a healthy book sector.

While correlation does not mean causality, it is possible to show that, far from greater library use being associated with lost tales, it is rather the opposite. These figures can be used in arguments to show that cuts to libraries – for example making it more difficult to visit and borrow – could be harmful to the book sector as a whole.


Find out more on the Library Map of the World, where you can download key library data in order to carry out your own analysis! See our other Library Stats of the Week! We are happy to share the data that supported this analysis on request.

Library Stat of the Week #48: In Countries with Stronger – and Better Used – Public and Community Library Fields, Books Account for Larger Shares of Household Spending on Culture

After a couple of weeks’ break, we’re back with a final mini-series of Library Stat of the Week posts, focusing this time on libraries and cultural data.

Cultural data itself is unfortunately not as widely collected as other types of data, partly because of a lack of widely adopted shared standards,  partly because – wrongly, we would suggest – it is not always a priority for statistical offices.

Fortunately, within the European Union, there is an effort to collect relevant information, looking at key questions such as how much households and governments are spending on culture, and how much people are benefitting from it.

Therefore, to close out our weekly series of library statistics posts, we are crossing data from the European Union’s Eurostat agency with data from IFLA’s Library Map of the World and the World Bank.

In this week’s post, we will look at the relationship between different public and community library indicators, and the share of total spending on cultural goods and services that goes on books.

The indicator of the share of total spending on books is useful, as it allows us to control for overall spending on culture in the population, which can vary strongly.

It also allows us to account for the fact that, arguably, different forms of culture are competing for our attention and available budgets. In other words, we can look at whether a stronger library field means that books ‘capture’ a larger share of cultural spending, a point that will be of interest, in particular to publishers and others in the book chain.

Data on spending on cultural goods and services comes from Eurostat’s database on mean expenditure by households on different goods and services. Data comes from 2015. Data on libraries comes from the Library Map of the World (most recent year), with World Bank population data (2018) used to allow us to calculate per capita figures.

As such, it is important to note that all data comes from European countries, but still allows for a look across a range of different library fields, and so can be useful for wider advocacy.

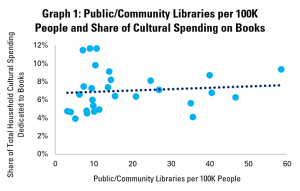
Graph 1: Public/Community Libraries per 100K People and Share of Cultural Spending on Books

Graph 1 starts by looking at shares of spending on books in total cultural spending in comparison with numbers of public and community libraries per capita.

In the graph, each point represents one country. The further to the right a point is, the more public and community libraries there are per 100 000 people, and the first up it is, the higher the share of books in overall household spending on cultural goods and services.

Looking at numbers of libraries gives an idea of how readily accessible libraries are to people, although of course does allow us to understand how well-supported each library is.

Overall, it appears then that there is a slight but small positive correlation between numbers of libraries and share of cultural spending on books.

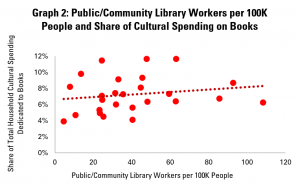
Graph 2: Public/Community Library Workers per 100K People and Share of Cultural Spending on Books

Graph 2 looks at numbers of public and community library workers (full-time equivalents), arguably a stronger indicator of the strength of library fields.

This shows a slightly stronger, slightly more positive correlation, suggesting that where there are more public and community library workers, books account for a greater share of household spending on cultural goods and spending.

However, in addition to looking at ‘inputs’ to a strong library field (i.e. number of libraries and staff), we can also look to understand how well they are used. Library Map of the World data on numbers of visits, loans and registered users can help in this regard.

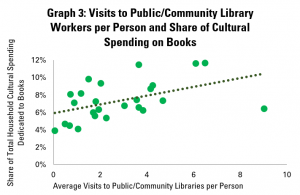
Graph 3: Visits to Public/Community Libraries per Person and Share of Cultural Spending on Books

Graph 3 therefore compares the average number of visits to public and community libraries per person per year with data on the share of household spending on cultural goods and services that goes on books.

This shows a stronger and more positive correlation still between use of libraries and spending on books. This would certainly vindicate the idea that libraries serve as venues for discovery of books, and so drive sales.

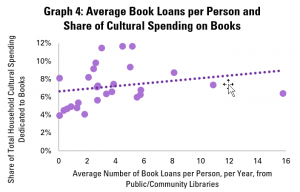
Graph 4: Average Book Loans per Person and Share of Cultural Spending on Books

Graph 4 repeats the exercise for loans of books. Once again, there is a positive correlation, although this is slightly less strong than for visits to libraries.

The fact that the connection is positive is nonetheless encouraging. Importantly, it is not negative!

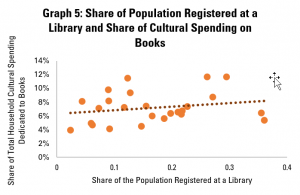
Graph 5: Share of Population Registered at a Library and Share of Cultural Spending on Books

Finally, graph 5 looks at the share of the population that is a registered library user. Once again, the correlation is positive, but slightly less strong than for the numbers of visits.

The weaker connection here could perhaps be associated with the fact that simply being registered is only a proxy for intensity of library use.


As ever, correlation does not mean causality, and so we cannot necessary say that stronger – and better used – public and community library fields mean that books account for a greater share of household cultural spending.

Nonetheless, they do show that the two often come together. In particular, the strongest connections appear to be with the most meaningful indicators of library use – visits and loans.

This data is therefore a useful reference in advocacy around libraries contributing to, rather than holding back, the economic success of the book sector.


Find out more on the Library Map of the World, where you can download key library data in order to carry out your own analysis! See our other Library Stats of the Week! We are happy to share the data that supported this analysis on request.

Filling the Evidence Gap: an Interview with Guy LeCharles Gonzalez, Panorama Project


The lending of eBooks by libraries remains an area of controversy, with libraries often facing high prices and difficult licencing conditions, while publishers worry about impacts on sales and revenues to authors.

A key challenge in this has been the relative newness of the format, and the lack of a shared evidence-base for understanding both eLending itself, and its interrelation with wider markets. The Panorama Project is aiming to address this. We interviewed Guy LeCharles Gonzalez, Project Lead, to find out more.


How well does anyone understand the eBook market and the place of libraries within it today?


The answer really depends on your perspective and priorities. The size of the overall consumer ebook market is difficult to measure because Amazon owns a significant percentage of it, especially on the self-publishing side, and they don’t publicly share any useful data. OverDrive is the dominant player on the library side, but NPD Bookscan doesn’t track ebook sales the same way they do print, and the American Association of Publishers (AAP) doesn’t break out library sales at all, so there’s no authoritative industry source for context.

Individual publishers generally have a good sense of where their ebook revenue comes from, but it’s mostly “last-click attribution” which heavily favors Amazon and OverDrive, and they generally don’t have a good sense of which factors might be impacting their consumer sales. They also don’t have deep data on what drives those sales, including the role of discoverability through libraries, nor any useful insights into print circulation. The combination of fragmentation and lack of transparency is one of the primary reasons the Panorama Project was initiated.


Why do you think that there is relatively little data out there?


Trade book publishing is a notoriously opaque industry, for a variety of reasons, including private ownership of most major publishers and intermediaries. Movies, music, and video games all have relatively transparent sales data that’s shared publicly and regularly dissected by their respective media outlets, but we rarely learn how many copies the latest New York Times’ (NYT) Bestsellers actually sold in any given week or year—unless it’s the rare breakout hit—despite it being one of the industry’s primary, albeit heavily curated and proprietary, measuring sticks. There are NYT Bestselling authors who’ve sold fewer copies of any book than the average middling video game, but they get to wear the badge anyway.


What impact has this had on the decisions that are being taken by different actors?


It’s led to some publishers making “data-driven” decisions about ebook pricing and access that lack proper context, potentially resulting in unintended changes to consumer behavior. Assuming library access is impacting consumer ebook sales and making strategic decisions based on that assumption is a risky bet—especially if Amazon is the primary source of the data driving that assumption. What if it’s not just library availability, but consumer ebook pricing, competition from other traditional publishers and self-publishers, or other forms of media, that is impacting your sales?

When you limit libraries’ access to your books, you cut off an important discovery and consumption channel for a segment of your audience. And when you do that purposefully, you’re as likely to drive readers to either wait until it’s available or borrow another book they’re interested in that is available, as opposed to converting them to buyers in another channel. If there was more transparency around sales data, and more understanding about discovery and purchase paths, the question of libraries’ actual impact would be a much easier question to answer. That requires purposeful, good faith collaboration. 


Where do you see the Panorama Project as making a difference?


Our primary goal is to encourage more productive, good faith conversations about public libraries in general—from discovery and engagement to direct and indirect impact on sales—so the industry can come to a collaborative consensus on how to measure their impact, whether it’s positive or negative. Our various initiatives are designed to provide data-informed insights on that impact in specific areas, while building a foundation for more effective collaboration moving forward.


How does the Panorama Project work?


A cross-industry Advisory Council with members from Penguin Random House, Sourcebooks, Open Road Media, American Library Association, Audio Publishers Association, NISO, Ingram Content Group, and OverDrive, serves as a sounding board for potential and ongoing initiatives. They offer insight and expertise in different areas to ensure those initiatives can have a measurable impact, and align with Panorama Project’s mission. We partner with different publishers, vendors, and organizations on specific initiatives, and I personally consult with a number of colleagues and experts across the industry for feedback and insights to ensure we’re on the right track.


How international is it or could it be?


We’re currently focused on public libraries in the United States, but we have occasional conversations about potential opportunities to expand our reach as there is international interest in our work. There are no specific plans currently in development, although I’d love to hear feedback from anyone who has ideas.


Clearly, support from OverDrive as one of the major commercial players in the market will raise some eyebrows. Should it?


It’s a fair concern and one I shared when I was initially approached to take on the role as Project Lead. OverDrive identified the need, helped convene the Advisory Council, and brought me on to run things—but our work is never tied to any specific OverDrive agenda, and everything we produce is fully transparent and widely shared for the benefit of the overall industry. The Advisory Council includes members from Penguin Random House, Sourcebooks, Open Road Media, American Library Association, Audio Publishers Association, NISO, Ingram Content Group, and OverDrive. One of our primary research initiatives for 2020—the Immersive Media & Reading 2020 Consumer Survey—is in partnership with the Authors Guild, ALA, Book Industry Study Group, Independent Book Publishers Association, and PubWest. I expect that kind of collaboration will become the norm for all of our future initiatives. 


What findings have you already established?


Some of our early initiatives measured the positive impact of library access on consumer sales on specific titles, most notably debut author Jennifer McGaha’s Flat Broke With Two Goats (Sourcebooks, 2018), the subject of our Community Reading Event Impact Report. Our Readers’ Advisory Impact Committee researched, documented, and analyzed the wide variety of RA title and author recommendation activities used in public libraries, and produced the Readers’ Advisory Directory. That initiative led to further research on Public Library Events & Book Sales which identified major gaps in publishers’ understanding and valuation of the monetary value of those libraries’ organic and purposeful marketing activities. 


What current work are you most excited about?


Our two main initiatives for 2020—the Immersive Media & Reading 2020 Consumer Survey, and Library Marketing Valuation Toolkit—grew out of the realization that a lack of transparency around data in the publishing industry is a major obstacle to establishing an effective foundation for collaboration. I’m particularly excited about the consumer research because it’s been years since anyone’s taken a good look at how book readers’ behaviors have evolved in the wake of ebooks and audiobooks, not to mention other immersive media like streaming and gaming. We’ve partnered with Portland State University and assembled a cross-industry committee to collaborate on developing the methodology and the survey itself, ensuring that the findings will not only be credible, but actionable. COVID-19 forced us to adjust our timeline, but we’re expecting to field the survey in the early Fall and have initial findings published before the end of the year.


How do you see COVID-19 changing the landscape of library eLending?


In the short-term, we’ve already seen reports of increased engagement with libraries’ electronic resources which, of course, leads to increased spending to meet that demand. Unfortunately, few libraries are going to come out of this period with increased budgets, so hard decisions will need to be made about materials budgets across the country. The longer the pandemic lasts, the more likely temporarily modified consumer behaviors will become permanent preferences, so I suspect we’ll see an acceleration in engagement with, and increased spending on, digital content. If schools face a prolonged period of remote learning through the Fall and into Winter, even if it’s a hybrid approach, that acceleration will probably be even faster.


What are the next big questions needing answering to your mind?


The main questions I proposed at the end of 2019 remain unanswered, and are arguably even more critical to answer in light of current events.

  1. How much of public libraries’ estimated $1.5 billion overall materials budget goes toward trade publishing’s estimated $12 billion in projected revenue for 2019, and where does that rank against other channels?
  2. How much marketing value do public libraries create for publishers through readers’ advisory services, physical shelf and online catalogue visibility, hosted author events, and community book clubs?
  3. How do library patrons discover and acquire the books they read and in which formats, and how does that fit with other media consumption and buying habits?

We’ve taken steps towards helping answer the second and third questions with our 2020 initiatives, while the first one still requires a level of collaboration across the industry that we haven’t seen yet. I’m hopeful that we’ll be in a better position to answer that one in 2021.

Library Stat of the Week #11: Despite sparse populations, there are relatively dense public library networks in Mongolia, Kazakhstan, Russia and Canada

As highlighted last week, a key characteristic – and indeed mission – of public libraries is to provide a service that responds to the needs of their communities.

This job can be made more difficult when the distance between people and libraries is greater, for example in rural communities. For people who lack transport, or are mobility impaired, the challenge is particularly acute.

In last week’s Library Stat of the Week, we looked at the density of public and community library networks by analysing how big an area – on average – each public library serves.

As could be expected, the densest networks were often in very small territories such as Macao, China, Hong Kong, China, and Singapore, although there were similar figures for areas served in some larger countries such as Czechia and India. The least dense networks were in very large countries and territories, such as Greenland, Australia, Mongolia and Canada.

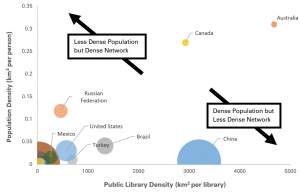
Graph comparing population density and library densityThe next step is to look at the relationship between population density and library density.

Graph comparing population density and library density

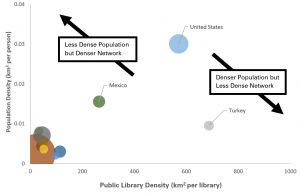
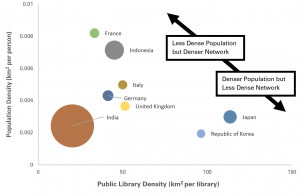
In the three graphs shown here, we compare the situation for G20 countries (with the exception of Saudi Arabia, for which public library data is not possible), with the size of dots indicating the population of each country concerned.

Graph comparing population density and library density

This makes it possible to explore to what extent countries with similar levels of population density have a more or less dense library network.

For example, China and Mexico have a similar level of population density, but Mexico has a much denser network. The same goes for India and Japan, where despite similar levels of population density, but India has a much closer network of libraries. In contrast, despite a much sparser population, the United States still has a closer public library network than Turkey.

Looking globally, we can calculate a global trend, and then calculate how much denser – or less dense – any given country’s public and community library network is in comparison with this.

Doing this, we can then calculate that it is in Mongolia, Kazakhstan, Russia and Canada that public library density is highest, once population density is taken into account. In effect, there is a form of ‘over-compensation’ for the sparsity of their populations, helping ensure that citizens have easier access to libraries.

At a regional level, it is Europe and Asia that have the densest networks after taking account of population density.

Meanwhile, Africa and the MENA region have the least dense networks of libraries, even after taking population density into account. It is in these countries in particular that efforts to boost not only coverage, but also digital tools which make it possible to overcome distance, are particularly pressing.

Of course, as highlighted in last week’s blog, a complete idea of how far individuals need to travel to reach a library can only be obtained with detailed data about where libraries are, and where people live. Nonetheless, this analysis gives a first idea of how different countries approach public and community library provision.


Find out more on the Library Map of the World, where you can download key library data in order to carry out your own analysis! See our other Library Stats of the Week! We are happy to share the data that supported this analysis on request.

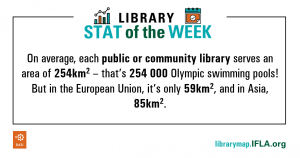
Library Stat of the Week #10: On average, each public or community library serves an area of 254km2 – that’s 254 000 Olympic swimming pools! But in the European Union, it’s only 59km2, and in Asia, 85km2

Library Stat of the Week #10: On average, each public or community library serves an area of 254km2 - that's 254000 Olympic Swimming Pool! But in the European Union it's only 59km2, and in Asia, 85km2One of the key strengths of libraries – in particular public and community libraries – is the fact that they are local.

Being close to the communities they serve gives them a unique potential to understand what people need, and to provide collections and services accordingly.

Of course, ‘closeness’ is about more than just geography, but this does undoubtedly play a role. When a single library needs to service a large area – for example rural or sparsely populated ones – it can be more difficult to ensure support to everyone who lives there. This is a particular concern for people who are disabled or otherwise find it difficult to move around.

Clearly detailed data about the average distance for any given individual to a library requires disaggregated data at the local level.

However, we can start to understand in which countries people may risk being the furthest away from libraries by calculating the average area that any given public or community library serves. We can do this by taking World Bank figures on the surface area of countries, and dividing this by the number of public and community libraries, as reported on IFLA’s Library Map of the World.

This gives us a total figure – for reporting countries – of 254km2 served per library – the equivalent of 254 000 Olympic swimming pools (each pool is 1000m2). There is – as always – variation! At the regional level, the European Union has the highest density of public libraries – one for every 50km2. Asia comes next, with one library for every 85km2.

At the national level, Asia claims both of the top spots, with Macao (one library for every 0.4km2) and Singapore (one every 2km2). Czechia has the densest network in Europe (one library for every 13km2), Moldova in non-EU Europe (one every 25km2), Réunion in Africa (one every 31km2), St Lucia in Latin America and the Caribbean (one every 32km2), Bahrain in MENA (one every 65km2), and New Zealand in Oceania (one every 631km2).

Clearly, as highlighted before, these figures are averages, and a more detailed understanding of how far people need to travel to get to a library requires more disaggregated data. Next week, we’ll move a step closer by looking at how population density and library density are related.


Find out more on the Library Map of the World, where you can download key library data in order to carry out your own analysis! See our other Library Stats of the Week! We are happy to share the data that supported this analysis on request.
Library Stat of the Week #6: Almost 2/3 of public libraries offer internet access globally. In Russia, over 27 000 public libraries do so!

Libraries have always been about access to information, in the present and into the future.

Traditionally – and of course this is what gave them their name – they were about books.

However, with a growing share of information now online – including from sources that used to be printed – internet access has, in many places, become a core part of the library ‘offer’ to users.

Libraries can bring particular strengths to this. Clearly, public internet access in itself provides a solution for people who do not have their own connection.

But it can be combined with other services, such as access to terminals, training, or wider support. Libraries can even act as nodes in wider connectivity schemes.

But how many libraries are already connected to the internet, and offering this possibility to their users?

Data from IFLA’s Library Map of the World allows us to start building an understanding of the situation, using latest available numbers.

For the moment, 30 countries from almost all world regions (only North America is missing) have submitted data about both the number of public libraries they have, and the number offering internet access.

Across this group, almost 2/3 (64%) of all public libraries offer internet access, with the largest single number being in Russia, with over 27 000.

In Europe, a number of countries have internet access in all public libraries, including Estonia, Latvia, Slovenia, Andorra and Finland. In Africa, 92% of Kenya and 84% of South African public libraries offer access. In Latin America, 89% of libraries in Saint Lucia do so, while in Asia, there are figures of 100% for Mongolian and 99% for Thai public libraries.

These figures help underline both the potential in some countries to use libraries as a network for digital public projects, as well as the need for investment in others.

Find out more on the Library Map of the World, where you can download key library data in order to carry out your own analysis! See our other Library Stats of the Week! We are happy to share the data that supported this analysis on request.