Tag Archives: community library

Library Stat of the Week #49: Faced with Competition from Online Entertainment, Household Spending on Books Has Held Up Better Where Libraries are Stronger

In a three-part series to end our regular #LibraryStatOfTheWeek posts, we are looking at data around culture, and crossing this with information gathered by IFLA through the Library Map of the World.

Last week’s post – the first of the mini-series – therefore looked at the link between the strength of library fields (including how well used they are), and the share of household spending on culture that is dedicated to books.

This is a helpful indicator, especially in a digital age where different activities are competing for our free time and resources. Given that overall tendencies to spend on culture will be determined by a variety of external factors (earnings and disposable incomes for example), this can even be a more meaningful way of understanding the place of reading – and books – in societies.

Libraries themselves have an important role in promoting reading, both in terms of helping adults discover new works, and in ensuring that coming generations turn into capable and confident readers.

This week, we look beyond the figures for one year (2015), and rather at evolutions in spending between the two years for which data is available – 2010 and 2015. This allows us to see how well spending on books, as a share of overall household cultural spending, has fared at a time that new online cultural activities were emerging.

Once again, data on household cultural spending comes from Eurostat (and so focuses only on European countres), while data on libraries and use comes from the IFLA Library Map of the World (latest available year), crossed with population data from the World Bank in order to obtain per capita figures. In each of the analyses noted below, we have only included a country when all relevant data was available.

Graph 1: Public/Community Libraries per 100 000 People and Change in Share of Household Cultural Spending on Books

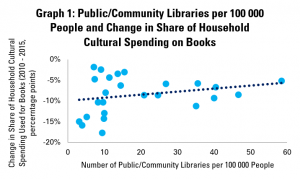
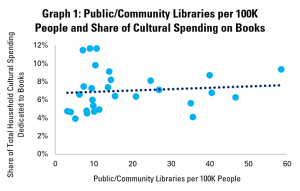
Graph 1 starts by comparing numbers of public and community libraries per 100 000 people with the change in the share of household cultural spending going on books between 2010 and 2015.

In the graph, each dot represents a country. The higher it is, the more positive the change in share of spending has been. The further to the right it is, the more libraries there are per 100 000 people.

It is worth noting that, in all countries covered by this data, the share of household cultural spending going on books has fallen. This makes sense, given the points set out above concerning the rise of online entertainment.

The graph indicates that, in general, countries with higher numbers of public and community libraries per 100 000 people have tended to see smaller falls in the share of cultural spending going on books.

Graph 2: Public/Community Library Workers per 100 000 People and Change in Share of Household Cultural Spending on Books

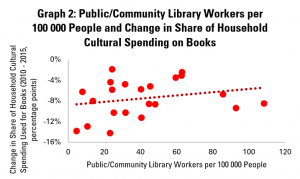
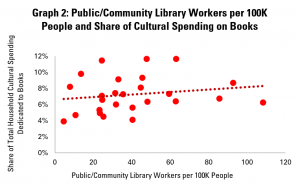
Graph 2 looks rather at numbers of public and community library workers per 100 000 people. Dots further to the right on this graph therefore indicate countries with a higher number of such workers.

Here too, the story is positive – where there are more public and community library workers, in general, falls in the share of household cultural spending going on books have been lower. In other words, book sales have resisted better to competition where libraries are stronger.

Graph 3: Public/Community Visits per Capita and Change in Share of Household Cultural Spending on Books

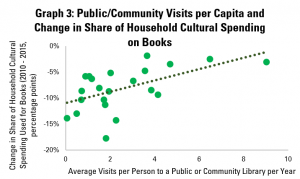
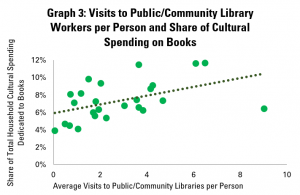
Graph 3 looks at numbers of visits per person to public and community libraries. This shows a relatively strong, positive correlation between library use and changes in the share of household cultural spending going on books.

This tallies with the finding last week that library visits, in particular, seem to be well-connected to the economic situation of the book sector. This makes sense – libraries can be important shop-windows, and of course also build enthusiasm for reading.

Graph 4: Library Book Loans per Capita and Change in Share of Household Cultural Spending on Books

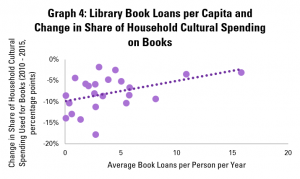
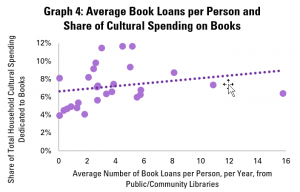
Graph 4 looks at average numbers of book loans per capita. Again, there is a positive correlation – and indeed a stronger and more positive one than in the graph last week looking at spending in just one year.

In other words, library lending tends to be associated with better performance over time for the book sector.

Graph 5: Change in Share of Household Cultural Spending on Books and Share of Registered Library Users in the Population

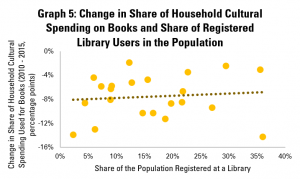
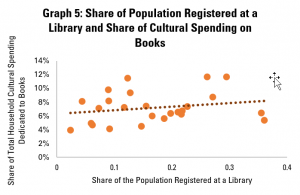
Graph 5, finally, looks at connections between numbers of registered library card holders (calculated as a share of the population), and trends in the share of books in total household cultural spending.

This again shows a positive correlation, although a less strong one, although partly driven by the result for Spain, where there is a high rate of library card holding, but also a big fall in spending on books as a share of overall cultural spending.


Overall, these figures provide further helpful support for advocacy around the value of our institutions in supporting a healthy book sector.

While correlation does not mean causality, it is possible to show that, far from greater library use being associated with lost tales, it is rather the opposite. These figures can be used in arguments to show that cuts to libraries – for example making it more difficult to visit and borrow – could be harmful to the book sector as a whole.


Find out more on the Library Map of the World, where you can download key library data in order to carry out your own analysis! See our other Library Stats of the Week! We are happy to share the data that supported this analysis on request.

Library Stat of the Week #48: In Countries with Stronger – and Better Used – Public and Community Library Fields, Books Account for Larger Shares of Household Spending on Culture

After a couple of weeks’ break, we’re back with a final mini-series of Library Stat of the Week posts, focusing this time on libraries and cultural data.

Cultural data itself is unfortunately not as widely collected as other types of data, partly because of a lack of widely adopted shared standards,  partly because – wrongly, we would suggest – it is not always a priority for statistical offices.

Fortunately, within the European Union, there is an effort to collect relevant information, looking at key questions such as how much households and governments are spending on culture, and how much people are benefitting from it.

Therefore, to close out our weekly series of library statistics posts, we are crossing data from the European Union’s Eurostat agency with data from IFLA’s Library Map of the World and the World Bank.

In this week’s post, we will look at the relationship between different public and community library indicators, and the share of total spending on cultural goods and services that goes on books.

The indicator of the share of total spending on books is useful, as it allows us to control for overall spending on culture in the population, which can vary strongly.

It also allows us to account for the fact that, arguably, different forms of culture are competing for our attention and available budgets. In other words, we can look at whether a stronger library field means that books ‘capture’ a larger share of cultural spending, a point that will be of interest, in particular to publishers and others in the book chain.

Data on spending on cultural goods and services comes from Eurostat’s database on mean expenditure by households on different goods and services. Data comes from 2015. Data on libraries comes from the Library Map of the World (most recent year), with World Bank population data (2018) used to allow us to calculate per capita figures.

As such, it is important to note that all data comes from European countries, but still allows for a look across a range of different library fields, and so can be useful for wider advocacy.

Graph 1: Public/Community Libraries per 100K People and Share of Cultural Spending on Books

Graph 1 starts by looking at shares of spending on books in total cultural spending in comparison with numbers of public and community libraries per capita.

In the graph, each point represents one country. The further to the right a point is, the more public and community libraries there are per 100 000 people, and the first up it is, the higher the share of books in overall household spending on cultural goods and services.

Looking at numbers of libraries gives an idea of how readily accessible libraries are to people, although of course does allow us to understand how well-supported each library is.

Overall, it appears then that there is a slight but small positive correlation between numbers of libraries and share of cultural spending on books.

Graph 2: Public/Community Library Workers per 100K People and Share of Cultural Spending on Books

Graph 2 looks at numbers of public and community library workers (full-time equivalents), arguably a stronger indicator of the strength of library fields.

This shows a slightly stronger, slightly more positive correlation, suggesting that where there are more public and community library workers, books account for a greater share of household spending on cultural goods and spending.

However, in addition to looking at ‘inputs’ to a strong library field (i.e. number of libraries and staff), we can also look to understand how well they are used. Library Map of the World data on numbers of visits, loans and registered users can help in this regard.

Graph 3: Visits to Public/Community Libraries per Person and Share of Cultural Spending on Books

Graph 3 therefore compares the average number of visits to public and community libraries per person per year with data on the share of household spending on cultural goods and services that goes on books.

This shows a stronger and more positive correlation still between use of libraries and spending on books. This would certainly vindicate the idea that libraries serve as venues for discovery of books, and so drive sales.

Graph 4: Average Book Loans per Person and Share of Cultural Spending on Books

Graph 4 repeats the exercise for loans of books. Once again, there is a positive correlation, although this is slightly less strong than for visits to libraries.

The fact that the connection is positive is nonetheless encouraging. Importantly, it is not negative!

Graph 5: Share of Population Registered at a Library and Share of Cultural Spending on Books

Finally, graph 5 looks at the share of the population that is a registered library user. Once again, the correlation is positive, but slightly less strong than for the numbers of visits.

The weaker connection here could perhaps be associated with the fact that simply being registered is only a proxy for intensity of library use.


As ever, correlation does not mean causality, and so we cannot necessary say that stronger – and better used – public and community library fields mean that books account for a greater share of household cultural spending.

Nonetheless, they do show that the two often come together. In particular, the strongest connections appear to be with the most meaningful indicators of library use – visits and loans.

This data is therefore a useful reference in advocacy around libraries contributing to, rather than holding back, the economic success of the book sector.


Find out more on the Library Map of the World, where you can download key library data in order to carry out your own analysis! See our other Library Stats of the Week! We are happy to share the data that supported this analysis on request.

Library Stat of the Week #10: On average, each public or community library serves an area of 254km2 – that’s 254 000 Olympic swimming pools! But in the European Union, it’s only 59km2, and in Asia, 85km2

Library Stat of the Week #10: On average, each public or community library serves an area of 254km2 - that's 254000 Olympic Swimming Pool! But in the European Union it's only 59km2, and in Asia, 85km2
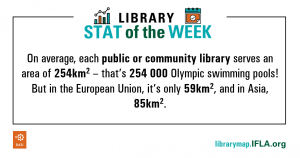
One of the key strengths of libraries – in particular public and community libraries – is the fact that they are local.

Being close to the communities they serve gives them a unique potential to understand what people need, and to provide collections and services accordingly.

Of course, ‘closeness’ is about more than just geography, but this does undoubtedly play a role. When a single library needs to service a large area – for example rural or sparsely populated ones – it can be more difficult to ensure support to everyone who lives there. This is a particular concern for people who are disabled or otherwise find it difficult to move around.

Clearly detailed data about the average distance for any given individual to a library requires disaggregated data at the local level.

However, we can start to understand in which countries people may risk being the furthest away from libraries by calculating the average area that any given public or community library serves. We can do this by taking World Bank figures on the surface area of countries, and dividing this by the number of public and community libraries, as reported on IFLA’s Library Map of the World.

This gives us a total figure – for reporting countries – of 254km2 served per library – the equivalent of 254 000 Olympic swimming pools (each pool is 1000m2). There is – as always – variation! At the regional level, the European Union has the highest density of public libraries – one for every 50km2. Asia comes next, with one library for every 85km2.

At the national level, Asia claims both of the top spots, with Macao (one library for every 0.4km2) and Singapore (one every 2km2). Czechia has the densest network in Europe (one library for every 13km2), Moldova in non-EU Europe (one every 25km2), Réunion in Africa (one every 31km2), St Lucia in Latin America and the Caribbean (one every 32km2), Bahrain in MENA (one every 65km2), and New Zealand in Oceania (one every 631km2).

Clearly, as highlighted before, these figures are averages, and a more detailed understanding of how far people need to travel to get to a library requires more disaggregated data. Next week, we’ll move a step closer by looking at how population density and library density are related.


Find out more on the Library Map of the World, where you can download key library data in order to carry out your own analysis! See our other Library Stats of the Week! We are happy to share the data that supported this analysis on request.