In part one of the last of our mini-series on libraries and cultural data – and indeed the last of our regular Library Stat of the Week posts for now – we’re looking at data about libraries and the wider cultural field.
This follows two posts exploring the relationship between libraries and the book sector, measured in terms of the share of household spending on culture going on books across countries for which culture is available.
In this post, we make use of Eurostat data about frequency of participation in artistic activities (in general), and regularity of attendance at cultural events (cinema, live performances, and cultural or heritage institutions such as museums).
Once again, we also draw on data from IFLA’s Library Map of the World, combined with World Bank population data.
Given that Eurostat data only covers Europe, and that Library Map of the World data is not complete for every country, we have limited analysis to those countries for which data is available.
The goal is to explore what relationships exist between the existence and use of libraries and broader cultural participation. The thesis is that libraries can act as a gateway to culture, providing opportunities that are both local, and free, for people to discover creativity, both in others and in themselves.
The first part of this post looks at data around participation in artistic activities, compared to different metrics of availability of libraries (measured by the number of public and community libraries per 100 000 people), and their use (measured by numbers of visits and loans per capita).
Participation in such artistic activities can be used as a proxy for levels of creativity, as well as a broader indicator of the strength of culture.
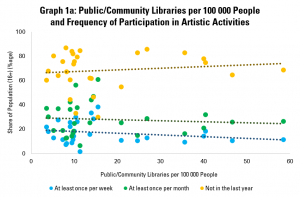
Graph 1a therefore compares the shares of the population reporting that they participate in artistic activities at least once a week, at least once a month, and not at all in the last year, with the number of public and community libraries per 100 000 people.
In this (as in all the graphs in this post), each dot represents one country. The higher up a dot is, the higher the share of people reporting that they practice an artistic activity at a given frequency. The further to the right it is, the more public or community libraries there are per 100 000 people in the country.
This finds little relationship between the presence of public and community libraries and levels of participation in artistic activities.
However, as in previous posts, it is worth looking at just those countries with up to 20 public or community libraries per 100 000 people (above the European and global averages) – this allows us to exclude more extreme cases.
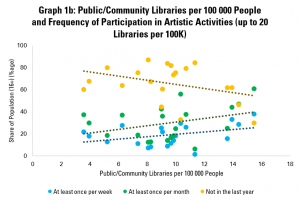
Graph 1b does this, showing a much stronger link between the presence of libraries and participation in artistic activities. More public and community libraries tends to be associated with greater shares engaging regularly in artistic activities (and smaller shares not engaging at all).
For example, every extra public or community library per 100 000 people tends to be associated with a fall of almost 2 percentage points in the share of the population not engaging in artistic activities at all.
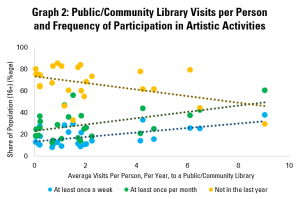
Graph 2 continues the analysis, but looking rather at a key indicator of intensity of use of libraries – the average number of visits per person per year. This finds a similar trend as in Graph 1b, with more regular visits to libraries associated with higher engagement in artistic activities.
Here, every one additional visit to a public or community library per person per year is associated with an almost three point rise in the share of the population engaging in artistic activities at least once a month.
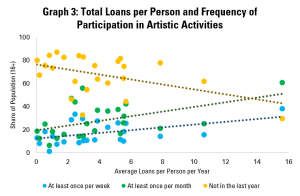
Graph 3 does the same but with the average number of loans per person per year, and again shows that more regular borrowing of books tends to be associated with more regular participation in artistic activities. Each additional loan per person per year tends to be linked with a fall of over two points in the share of the population not engaged in any artistic activity in the past year.
Overall, these graphs underline the connection between the presence and use of libraries, and wider involvement in artistic activities. Clearly, we cannot say for sure say that there is causality in one direction or the other. Indeed, both library use and other artistic activity could be the result of a single cause, such as a strong focus on culture in education or a wider appreciation of being cultured.
Nonetheless, it does support the argument that societies which are more involved in artistic activities – and so which arguably encourage creativity – are characterised by a greater number of public libraries (at least up to around 20 public libraries per 100 000 people), and more intense use of these.
The second part of this post looks at data around frequency of participation in specific cultural activities – namely visits to the cinema, going to live performances (theatre, concerts), and visits to cultural or heritage institutions (including monuments and museums).
This data, as far as it appears, does not include data on library visits. However, it provides an insight into the strength of the wider cultural sector. In particular, larger numbers of people going regularly to the cinema or a live performance, or visiting a cultural or heritage institution, bring advantages in terms of revenues for each of the sectors concerned.
The following analyses look at how the share of the population carrying out these different activities regularly (at least four times a year) compares with numbers of visits to libraries per person per year, as an indicator of how well used libraries are.
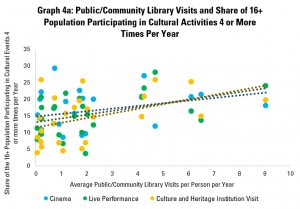
Graph 4a therefore looks at the share of the population aged 16 or more going to each of the three types of cultural event four or more times per year. It indicates a positive correlation – in countries where there are higher average numbers of library visits per year, there are also more people going regularly to the cinema, to live events, or to cultural or heritage institutions.
The most positive correlation here is between visits to libraries and visits to cultural or heritage institutions, with live performances and cinema following closely behind. For every additional library visit per person per year, there tends to be a rise of 1.4 points in the share of the population visiting cultural or heritage institutions regularly.
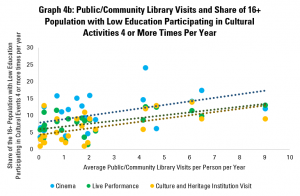
Graph 4b looks specifically at the case of people with lower education (defined as less than primary and lower secondary education), given that people in this situation can be at risk of exclusion. A break-down of this data is not available for libraries, and so data for the whole population is used.
The graph indicates that levels of regular participation in different events or activities are lower than for the population as a whole. However, we see the same positive connections with even stronger correlations between average use of libraries (for the population as a whole), and participation in different activities (for people with lower education).
In other words, there is an indication that there may be links between use of libraries and participation in other events, even for those who may otherwise be at risk of exclusion.
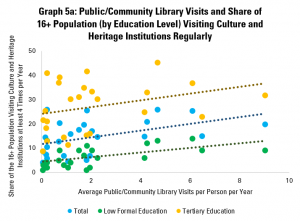
Graph 5a looks specifically at cultural and heritage institutions, given that these are, in other circumstances, often considered as part of a group with libraries (GLAMs). They can also have similar functions as community spaces, where visitors have more freedom to discover for themselves.
In addition to the positive link between library visits per capita and shares of the population as a whole, it helps underline similar positive links for people with both high and low levels of formal education. Interestingly, the strength of the correlation is highest for those only primary and lower secondary education.
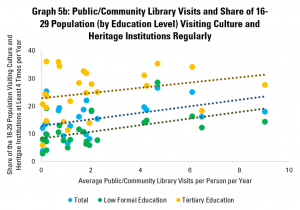
Graph 5b repeats the analysis for younger people (aged 16-29) and comes to a similar conclusion – where there are more visits to libraries per person (again, for the whole population), there tend to be higher numbers of people regularly visiting cultural and heritage institutions.
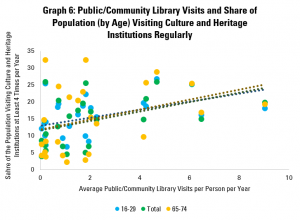
Finally, Graph 6 looks rather at trends for different age groups. This finds very little difference in the relations between library visits (for the whole population) and for the share of younger (16-29 year olds), older (65-74 year olds) and the population as a whole (anyone over 16). In each case, the connection is positive.
This post has looked at different indicators of levels of participation in culture. Maximising this participation can be seen as a goal in itself, a driver of wellbeing for individuals, a support for the cultural sector, and as a foundation for strong economies and societies in general.
While, as always, correlation cannot be read as causality, there certainly are positive links between levels of presence and use of public and community libraries and engagement in artistic activities. The same goes for visits to public and community libraries and regularly going to the cinema, live performances and other cultural and heritage institutions, including across age groups and levels of education.
The data presented here therefore supports the argument that a well-supported and well-used public and community library field tends to be associated with wider participation in artistic and cultural activities, either as a gateway or as a complement. It can help support arguments for libraries to be considered as a key part of cultural policy, as a support for the wider creative economy, and indeed as actors in boosting creativity in general.
Part two of this post will look, finally, at data around the strength and use of public and community libraries and reading habits.
Find out more on the Library Map of the World, where you can download key library data in order to carry out your own analysis! See our other Library Stats of the Week! We are happy to share the data that supported this analysis on request.