This week and next, the Internet Governance Forum is taking place, fittingly enough, online.
This is an opportunity to return to data about connectivity in order to provide more background on the role of libraries in helping people get the most of the internet.
The Forum itself has a strong focus on the internet as a driver of inclusion. Clearly, the most immediate way of looking at this is by counting the number of people or households which do have access.
However, simply having a connection is not always enough. When this is not fast enough (for example, where it is still a dial-up connection), or where the household does not have a computer, there is less potential to realise the full potential of the internet.
Clearly, during the pandemic, this has been a major issue, with low speeds or data caps, and a lack of (enough) computers making it more difficult for people to learn, work, or apply for support.
Libraries have long provided a valuable complement to home access, offering higher connection speeds and the necessary hardware to use the internet, even in countries which are nearing 100% connectivity officially.
To get a better idea of the numbers, we look this week at Organisation for Economic Cooperation and Development data about internet access, and in particular the differences in the shares of people counted as having internet access, and those with broadband access (i.e. higher speed internet) and computers (the devices to use it).
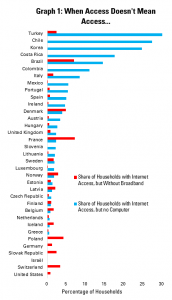
Graph 1 looks at the share of households in the overall population which count as being officially connected, but which in reality lack the key conditions to use the internet – a good quality connection and a computer.
In this graph, a longer bar indicates a higher share of households in the categories set out (connected to the internet, but not with a computer, or connected but without broadband)
In the median country, about 1 in 40 households are connected but do not have a computer, although in a number of countries, this share is much higher, reaching over 1 in 5 households in Turkey, Chile and Korea.
Meanwhile, about 1 in 100 households are connected to the internet, but do not have a broadband, but this rises to around 1 in 14 in France and Brazil.
Do these numbers stand throughout the population, or does the challenge of inadequate home internet access affect some groups more than others?
To start, it’s worth reminding ourselves of the degree to which coming from a richer or poorer household affects the likelihood of having a good internet connection and a computer.
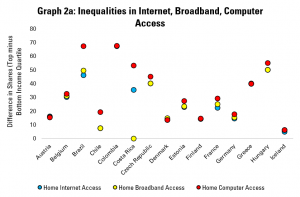
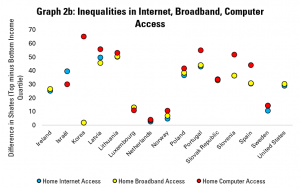
Graphs 2a and 2b do this, showing the gaps in the share of households in the top and bottom income quartiles (i.e. the richest and poorest quarters) which have internet access, broadband, or a computer.
In these graphs, each dot represents the difference in the share of richer and of poorer households having access.
These show big gaps, in particular in computer access, with a difference of over 50 percentage points between rich and poor in Brazil, Chile, Costa Rica, Hungary, Korea, Latvia, Lithuania, Portugal and Slovenia. Iceland, the Netherlands, Norway, and Sweden tend to have the lowest inequalities here.
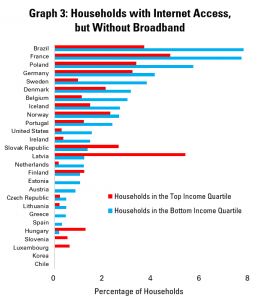
Graph 3 repeats the analysis in Graph 1, but focusing on people with ‘slow’ connections (i.e. connected but without broadband). It breaks out the figures for poorer and richer households, in order to establish whether people in poorer households are more likely to be stuck with such ‘slow’ connections than richer people.
This does appear to be the case in almost all countries. For example, in Germany, Poland, France and Brazil, over 4% of all poorer households are stuck with slower connections. This represents 5% of all those people in poorer households classed as connected in Germany, around 10% in France and Poland, and nearly 17% in Brazil.
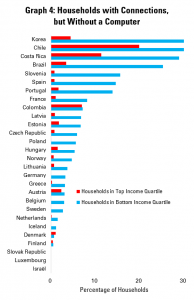
Graph 4 does the same, but looking at households which are connected, but which do not have computers. It is even clearer here that richer households are less likely to find themselves in the situation of being connected, but not having a device, than poorer households.
In Korea, Chile, Costa Rica and Brazil, over 25% of poorer households are in this situation of ‘device-less connectivity’. In effect, 2/3 of poorer Korean households which are officially connected to the internet do not have devices, while the figure is around 50% in Costa Rica and Brazil, and over 1/3 in Chile.
What lessons from this for libraries? Next week, we will combine some of this data with information about libraries offering internet access. What is does indicate, already, is that there is not only a significant issue in terms of inequality in internet access, but that even where households are officially connected, we need to look hard at whether they have the speed and devices to make this meaningful.
This is of course not to mention the more human aspects – skills, confidence, support – which may also hold people back from using the internet fully as well!
As highlighted in the introduction, libraries have a role not only in providing connectivity for the unconnected, but also a solution when this home connectivity is not good enough. As this post shows, in many countries, addressing this need is a real issue.
Find out more on the Library Map of the World, where you can download key library data in order to carry out your own analysis! See our other Library Stats of the Week! We are happy to share the data that supported this analysis on request.