Tag Archives: students

Library Stat of the Week #39: Globally, 1st and 2nd generation immigrant students make more intensive use of libraries than their native peers

One of the most worrying aspects of the COVID-19 pandemic and its consequences has been the deepening of the educational divide.

As highlighted in the Gates Foundation’s Goalkeepers report, there is a significant risk that the closure of school buildings will increase inequalities. In effect, groups that previously faced risks of worse educational outcomes face an even higher risk now.

While it is difficult to gather statistics on what is happening already, we can at least look back at available data to understand what factors might contribute to combatting this inequality. This can provide a basis for planning for the recovery afterwards.

Fortunately, the dataset from the Organisation for Economic Cooperation and Development’s Programme for International Student Assessment (OECD PISA) 2009 offers insights here.

We have already been able, in previous posts, to note the connection between access to a library and enjoyment of reading, and library availability and literacy skills.

This post looks to understand the connections between library use and just one potential vector of inequality – immigrant status.

As part of its data collection, as well as measuring levels of literacy and asking questions about library use, PISA 2009 also asked if the 15-year olds involved were first or second generation immigrants, or ‘native’ (i.e. all others). This allows us then to look at how far immigrant children, and the children of immigrants, depend on libraries.

Graph 1a: Difference in Library Usage (1st Generation Immigrants minus Native)

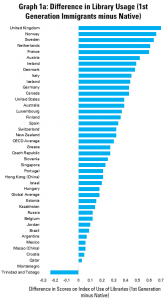
Graph 1a looks at the situation for 1st generation immigrants, providing for each country a figure for the difference between immigrant and ‘native’ 15 year olds in terms of scores on the index of library use compiled by the OECD. This index is made up of figures related to how often students borrow books – for work or pleasure – or use the library in other ways, and runs from -1 to 1.

In the graph, a longer bar to the right indicates that 1st generation immigrant students use the library more intensively than natives. A bar to the left indicates that they use it less.

Overall, the conclusion is clear – in all but two countries, 15-year olds with a 1st generation immigrant background make much stronger use of libraries than native peers.

Graph 1b: Difference in Library Usage (1st Generation Immigrants minus Native)

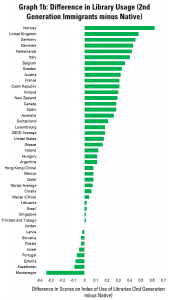
Graph 1b replicates this analysis, but comparing 2nd generation immigrant students to ‘native’ students. While the effect is less strong, only 9 of the 43 countries for which data is available see 2nd generation immigrant students use libraries less than native students.

In both graphs, the United Kingdom and Norway share the top spots in terms of how much more immigrant students use libraries than natives.

These graphs also send a clear signal – libraries tend to be better used by students who can risk otherwise being left behind. It follows that any reduction in the possibility to use libraries is more likely to hurt students from immigrant backgrounds.


Graphs 1a and 1b allow us to look at individual countries. What about overall trends, for example when we compare these figures with how students perform in general on literacy, or how much native students use libraries?

Graph 2: Difference in Levels of Library Use (1st/2nd Generation Immigrants vs Native) Compared with Overall Reading Scores

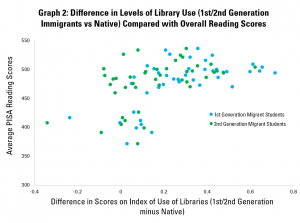
Graph 2 looks at the first of these questions, comparing the difference in library usage between 1st/2nd generation immigrant students and native peers (horizontal axis) and average scores for literacy for the whole population (vertical axis). Each dot represents a country.

Overall, there appears to be a positive correlation, with higher gaps in levels of library usage between immigrants and natives leading to higher overall reading scores.

In reality though, it perhaps makes more sense to see the countries presenting as falling into two groups – one of higher performers (usually richer countries) in the top right, and a group of less developed ones in the cluster in the middle-left.

In each of these groups, there is in fact little correlation between differences in library use and overall reading scores.

The lesson from this is then that the value of libraries to immigrant students does not depend on how well a country is performing in general – libraries seem to matter in both cases.

Graph 3: Difference in Levels of Library Use (1st/2nd Generation Immigrants vs Native) Compared with Native Library Use

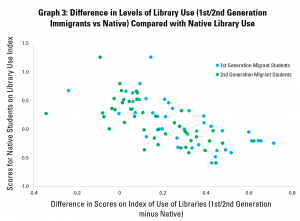
Graph 3 repeats this, but this time, the vertical axis looks at levels of library use among native students. Here, there is a more obvious correlation, with differences in library usage higher in situations where native students are using them less.

To some extent, this is logical – if natives use libraries less, and immigrants use them to the same extent, of course the gap will be higher.

In policy terms, however, the implication is that even where there is less use of libraries by native students, they continue to be important to immigrant students.


As highlighted last week, there appears to be a strong link in almost all countries surveyed between library use and scores in the literacy component of PISA.

This week’s statistics indicate that, in turn, 1st and 2nd generation immigrant students tend to be more intensive library users than their native peers. This connection tends to hold, regardless of the overall level of literacy in the population, and even when native students use libraries less.

While of course correlation cannot be taken for causality, the data here supports the argument that ensuring access to libraries will be an important part of any effort to close the education divide.


Find out more on the Library Map of the World, where you can download key library data in order to carry out your own analysis! See our other Library Stats of the Week! We are happy to share the data that supported this analysis on request.

Library Stat of the Week #31: Where there is more librarian support, the share of women completing degrees compared to men is higher

In last week’s Library Stat of the Week,  we looked at the relationship between the number of librarians per student and per researcher, and rates of completion of studies and publication per researcher respectively.

This week, we dig a little deeper into the first of these two questions by using gender dis-aggregated data for completion rates from the OECD.

In effect, this allows us to understand whether greater levels of academic or research librarian support for students (calculated by the number of students each librarian serves) can be associated with a more or less favourable gender gap for women.

Graphs 1, 2 and 3 do this for students at bachelor’s, masters and doctoral levels respectively. In each graph, each dot represents a country for which data is available.

On the horizonal (X) axis, there is the number of students per librarian. Countries which are more to the left have fewer students per librarian (a proxy for better librarian support), while those on the right have more students (and so less librarian support).

On the vertical (Y) axis, there is the result of subtracting the completion rate for women from the completion rate for men. A figure above zero indicates that a greater share of men complete their studies than women, while a figure below zero suggests that more women finish than men.

Graph 1: Bachelors Degree Completion Gap


Graph 2: Masters Degree Completion Gap

Graph 3: Doctoral Degree Completion Gap
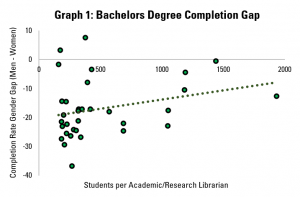
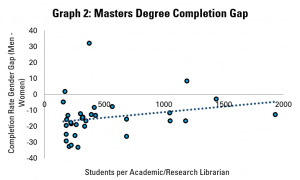
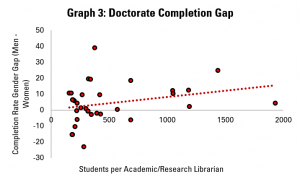
Across the three graphs – and so at all levels of study – it appears that where there is greater level of support from librarians (i.e. each librarian has fewer students to support), the gender gap is more favourable to women.

In terms of the strength of the relationship, it is relatively similar across the levels, with the closest correlation seen at doctoral level (which may make sense, given the intensity of research required for this).

Outside of library support, it is noticeable that while the gender gap tends to favour women at bachelors and masters level, more men tend to complete their doctorates than women.

As part of any gender equality strategy, efforts to ensure that more women get the qualifications needed to get into the highest skilled jobs are likely to play a key role. At the doctoral level, there is clearly work to be done. It could be worth looking further at the role that stronger libraries services can play in ensuring that women get the support needed to complete their studies at this level.


Find out more on the Library Map of the World, where you can download key library data in order to carry out your own analysis! See our other Library Stats of the Week! We are happy to share the data that supported this analysis on request.

Library Stat of the Week #30: Countries with more librarians per student tend to have higher completion rates

In last week’s Library Stat of the Week, we explored in more depth the relationship between numbers of students and researchers as a share of the population, and numbers of academic and research librarians available to support them.

This helped to highlight the variation that exists between countries, and in particular which ones manage to combine a strong student or research sector with adequate librarian support.

Having figures for the number of students and researchers allows us to look at potential relationships between the level of library support they receive (calculated in terms of the number of students or researchers an individual academic or research librarian serves) and outcomes.

Therefore, in this week’s Library Stat of the Week, we will be using, for the first time, OECD data on tertiary education completion rates (as a measure of whether students receive the support necessary to finish their courses), and publishing and patenting data, as used in previous editions.

Graph 1: Academic/Research Library Workers per Student and Student Completion Rates

Graph 1 looks at completion rates (from OECD data, for students at all levels) and compares these with previously calculated figures about the number of students each librarian serves on average.

It finds a small, negative correlation between the two – in other words, the more students an academic/research librarian needs to serve, the lower the likelihood of the student completing their studies.

Clearly, other factors also play out – the OECD itself notes that where courses are shorter, completion rates are higher, and of course student financing also plays a role.

Nonetheless, while of course this sort of analysis cannot show causation, it does indicate that where students have greater access to librarians, they are more likely to complete their courses.


Turning to research, our previous posts looking at the relationship between libraries and innovation were based on numbers of academic/research library workers in the population as a whole.

This, while showing that more librarians tended to mean more publications and more patents, had the weakness of neglecting indicators of the strength of the research field as a whole.

To remedy this, we can now use figures from the last two weeks which calculate the number of researchers each academic/research library worker has to serve, giving a much better idea of whether more (or less) library support for research correlates with outcomes in terms of publications and patents.

Graph 2: Academic/Research Library Workers per Researcher and Publications per Researcher

Graph 2 does this for publications, looking at whether researchers with more academic library support tend to publish more. To do this, we created a measure of number of publications per researcher by dividing figures for numbers of publications (World Bank) by those for the number of researchers (OECD).

The graph does indeed show this – when each academic/research library worker has fewer researchers to serve, the researchers tend to publish more articles each.

Graph 3: Academic/Research Library Workers per Researcher and Patents per Researcher

Graph 3 performs the same exercise for patents, using a figure for patents per researcher calculated again using World Bank and OECD data.

As with publications, this again shows a correlation, with countries where each academic or research library worker needs to serve fewer researchers each, on average, having higher rates of patenting per researcher.


As ever, correlation is not causation, although the analysis here does allow us to focus more precisely on the relationship between the strength of the academic and research library field and innovation performance per country.

While further research would be needed in order to demonstrate direct causality, these figures do allow us to say that those countries which provide stronger library support to students and researchers (as measured by numbers of students or researchers per academic and research library worker) tend to have higher student completion rates, and higher rates of publishing and patenting per researcher.


Find out more on the Library Map of the World, where you can download key library data in order to carry out your own analysis! See our other Library Stats of the Week! We are happy to share the data that supported this analysis on request.


Library Stat of the Week #28: On average, there are 305 students and 20 researchers per academic library worker

In recent weeks, we have looked at how numbers of academic libraries and library workers stand around the world, and what correlations there are between these, in relation to total populations, and indicators of innovation such as publishing and patenting.

Another angle worth exploring is the relationship between numbers of academic library workers, and those who benefit most directly from their services – students in tertiary education and people working in the research sector.

We can start to explore this by looking at data from the UNESCO Institute for Statistics on numbers of people working in research, and OECD data on the number of people registered in tertiary education, combined with data from IFLA’s Library Map of the World.

In each case, there is not data available for every country. In particular, OECD data is focused on its own members, with a few additional countries, meaning that averages offered are only relative to a part of the world.

Graph 1: Number of Students per Academic and Research Library Worker

Graph 1 looks at students. Students can benefit strongly from well-supported academic libraries, in order to help them benefit from well-designed collections, find resources effectively, and develop key skills.

The data available indicates that on average, each full-time academic library worker serves 207.7 students. The smallest number of students per librarian was in Germany – 157.6, with eight countries in total coming below the global average, of which seven are European, and the other is Canada.

Among other regions for which data is available, Colombia had the smallest number of students per librarian in Latin America and the Caribbean, and Japan in Asia-Oceania. There are some very high figures for numbers of students in some countries, which may be due to under-counting.

Graph 2a: Number of Researchers per Academic and Research Library Worker


Graph 2b: Number of Researchers per Academic and Research Library Worker

Graphs 2a and 2b look at research personnel (to note different scales on the vertical axis). As has been underlined in previous posts, libraries are a key part of the research infrastructure for any country, not only ensuring that researchers can access knowledge and ideas from elsewhere, but also increasing helping to ensure effective dissemination and management of data.

Globally, the data indicates that there are on average 20 research workers for every worker in an academic or research library.

The smallest number of academic and research library workers per researcher was in Colombia, with 0.6. Eight countries in total have fewer than five researchers per academic and research library worker – as well as Colombia, Panama, Kazakhstan, Honduras, Zimbabwe, Trinidad and Tobago, Mexico and Mauritius.

Meanwhile, a number of countries had figures of more than 100 researchers per academic or research librarian, although this may be down to under-reporting of numbers of librarians.


Clearly the profile of academic libraries themselves varies strongly, depending on institutions themselves. Some will focus much more on educating undergraduates, others much more on supporting more advanced research work.

As a result, a low number of researchers per librarian can be an indicator as much of a large number of librarians (because of strong investment in research libraries) as of a small number of researchers (because a institutions has relatively little focus on research, and more on teaching in general).

A similar reflection can apply to numbers of students. A system more focused on research may therefore employ more research librarians, raising the ratio of library workers to students, but so too could a smaller number of students.

We will explore these issues further next week.


Find out more on the Library Map of the World, where you can download key library data in order to carry out your own analysis! See our other Library Stats of the Week! We are happy to share the data that supported this analysis on request.