One of the most worrying aspects of the COVID-19 pandemic and its consequences has been the deepening of the educational divide.
As highlighted in the Gates Foundation’s Goalkeepers report, there is a significant risk that the closure of school buildings will increase inequalities. In effect, groups that previously faced risks of worse educational outcomes face an even higher risk now.
While it is difficult to gather statistics on what is happening already, we can at least look back at available data to understand what factors might contribute to combatting this inequality. This can provide a basis for planning for the recovery afterwards.
Fortunately, the dataset from the Organisation for Economic Cooperation and Development’s Programme for International Student Assessment (OECD PISA) 2009 offers insights here.
We have already been able, in previous posts, to note the connection between access to a library and enjoyment of reading, and library availability and literacy skills.
This post looks to understand the connections between library use and just one potential vector of inequality – immigrant status.
As part of its data collection, as well as measuring levels of literacy and asking questions about library use, PISA 2009 also asked if the 15-year olds involved were first or second generation immigrants, or ‘native’ (i.e. all others). This allows us then to look at how far immigrant children, and the children of immigrants, depend on libraries.

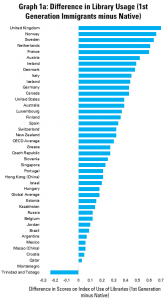
Graph 1a looks at the situation for 1st generation immigrants, providing for each country a figure for the difference between immigrant and ‘native’ 15 year olds in terms of scores on the index of library use compiled by the OECD. This index is made up of figures related to how often students borrow books – for work or pleasure – or use the library in other ways, and runs from -1 to 1.
In the graph, a longer bar to the right indicates that 1st generation immigrant students use the library more intensively than natives. A bar to the left indicates that they use it less.
Overall, the conclusion is clear – in all but two countries, 15-year olds with a 1st generation immigrant background make much stronger use of libraries than native peers.

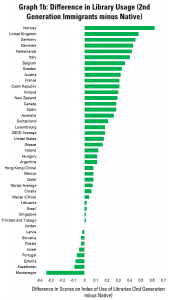
Graph 1b replicates this analysis, but comparing 2nd generation immigrant students to ‘native’ students. While the effect is less strong, only 9 of the 43 countries for which data is available see 2nd generation immigrant students use libraries less than native students.
In both graphs, the United Kingdom and Norway share the top spots in terms of how much more immigrant students use libraries than natives.
These graphs also send a clear signal – libraries tend to be better used by students who can risk otherwise being left behind. It follows that any reduction in the possibility to use libraries is more likely to hurt students from immigrant backgrounds.
Graphs 1a and 1b allow us to look at individual countries. What about overall trends, for example when we compare these figures with how students perform in general on literacy, or how much native students use libraries?

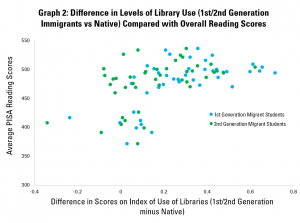
Graph 2 looks at the first of these questions, comparing the difference in library usage between 1st/2nd generation immigrant students and native peers (horizontal axis) and average scores for literacy for the whole population (vertical axis). Each dot represents a country.
Overall, there appears to be a positive correlation, with higher gaps in levels of library usage between immigrants and natives leading to higher overall reading scores.
In reality though, it perhaps makes more sense to see the countries presenting as falling into two groups – one of higher performers (usually richer countries) in the top right, and a group of less developed ones in the cluster in the middle-left.
In each of these groups, there is in fact little correlation between differences in library use and overall reading scores.
The lesson from this is then that the value of libraries to immigrant students does not depend on how well a country is performing in general – libraries seem to matter in both cases.

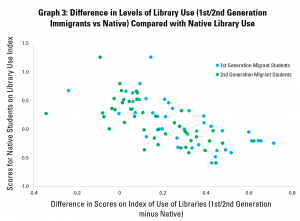
Graph 3 repeats this, but this time, the vertical axis looks at levels of library use among native students. Here, there is a more obvious correlation, with differences in library usage higher in situations where native students are using them less.
To some extent, this is logical – if natives use libraries less, and immigrants use them to the same extent, of course the gap will be higher.
In policy terms, however, the implication is that even where there is less use of libraries by native students, they continue to be important to immigrant students.
As highlighted last week, there appears to be a strong link in almost all countries surveyed between library use and scores in the literacy component of PISA.
This week’s statistics indicate that, in turn, 1st and 2nd generation immigrant students tend to be more intensive library users than their native peers. This connection tends to hold, regardless of the overall level of literacy in the population, and even when native students use libraries less.
While of course correlation cannot be taken for causality, the data here supports the argument that ensuring access to libraries will be an important part of any effort to close the education divide.
Find out more on the Library Map of the World, where you can download key library data in order to carry out your own analysis! See our other Library Stats of the Week! We are happy to share the data that supported this analysis on request.