Last week’s Library Stat of the Week looked at the connection between numbers of school libraries and levels of enjoyment of reading, combining data from IFLA’s Library Map of the World and the OECD’s PISA study.
As highlighted, simply counting the number of students per school library has limits as an indicator of the strength of the sector, as it depends heavily on the structure of schools as a whole.
It also does not account for the number of staff. As we have seen with public libraries in various previous posts, numbers of public and community library workers tend to be more closely linked to positive outcomes, such as literacy and equality.
An alternative perspective can come from digging deeper into the OECD’s PISA data. There is in fact a wealth of information specifically about libraries, based on their 2009 survey.
This post will therefore be the first of a series looking into the lessons we can gain from this source. Picking up on last week’s theme, this week’s blog looks at the links between students’ access to libraries – and use of them – and their level of enjoyment of reading.
As highlighted last week, this matters, as enjoyment of reading in turn is associated with higher overall reading performance.
Graphs 1a and 1b look at the data on the difference in level of enjoyment of reading between students who do, and do not have access to a library.
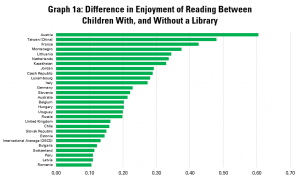
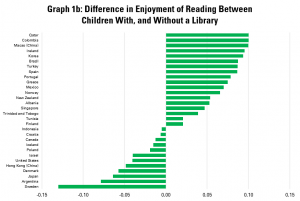
Given the number of countries, it is divided into two graphs, with countries organised according to the gap in levels of enjoyment of reading – the first graph shows countries where the difference in levels of enjoyment is highest.
We can therefore see that this is highest in Austria, Taiwan (China), France and Montenegro. In almost all countries, those who have libraries tend to enjoy libraries more than those don’t.
There are some exceptions though. Yet simply having a library does not mean that it is used. In order to dig further, it makes sense to look at how different types of library use are linked with enjoyment of reading.
Graphs 2a and 2b therefore look at the connection between how regularly 15-year-olds borrow books for fun, and their level of enjoyment of reading.
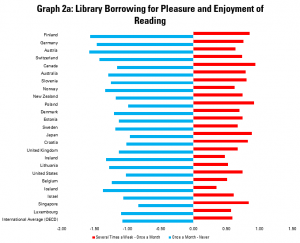
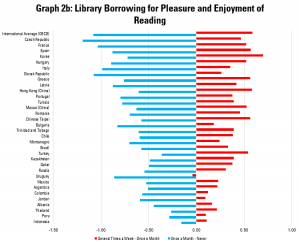 These graphs indicate levels of enjoyment of reading amongst 15-year olds who borrow books only once a month, compared to those who do so never, and those who do so several times a week.
In these graphs a longer blue line to the left indicates that there is a bigger gap in enjoyment of reading between occasional borrowers (once a month) and those who never read. A longer red line to the right indicates a bigger gap in enjoyment between very regular borrowers (several times a week) and occasional ones (once a month).
It is not a surprise of course that there is a connection between the two here – in every country, those who borrow more enjoy reading more. Interestingly, in general, the gaps are bigger between occasional library borrowers and those who never borrow, rather than between the more frequent and the occasional borrowers.
It is in Finland, Germany, Austria and Switzerland where the links between regularity of borrowing books and enjoyment of reading are strongest. The implication here is that building up a habit of library borrowing can correlate with enjoyment of reading.
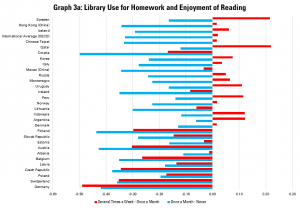
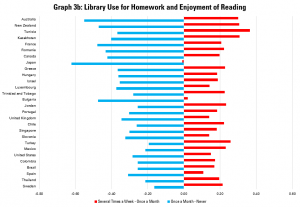 Graphs 3a and 3b look at the links between levels of enjoyment of reading and how often students use the library to carry out homework.
In these graphs a longer blue line to the left indicates that there is a bigger gap in enjoyment of reading between those who occasionally use the library to do homework (once a month) and those who never do. A longer red line to the right indicates a bigger gap in enjoyment between very regular users of the library for homework (several times a week) and occasional ones (once a month).
As can be expected, the difference between level of enjoyment of reading between those who use libraries to do homework regularly, and those who don’t, are less marked than in the previous example.
Nonetheless, the connection is positive in all but one country, suggesting that having library spaces which are suitable for children to do homework is associated with more positive attitudes toward reading. Australia and New Zealand see the most positive connections in this regard.
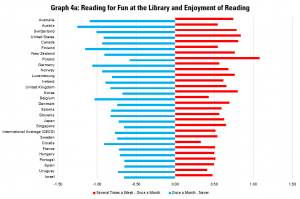
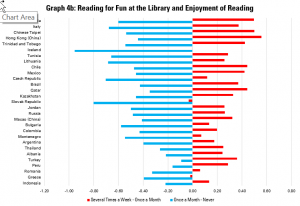 Finally, graphs 4a and 4b look at the links between enjoyment of reading and using the library to read for fun. Again, it is expected that more regular reading for fun at the library is linked to greater enjoyment of reading in general.
In these graphs a longer blue line to the left indicates that there is a bigger gap in enjoyment of reading between those who occasionally use the library to read for fun (once a month) and those who never do. A longer red line to the right indicates a bigger gap in enjoyment between very regular users of the library to read for fun (several times a week) and occasional ones (once a month).
In every country, the link is positive. As with borrowing of books, it also seems that there are bigger gaps between those who visit occasionally and those who never visit, than between the most regular users and more occasional ones.
Again, Australia, followed by Austria, Switzerland and the United States, has the most dramatic links between reading for fun at the library and enjoyment of reading overall.
This would support the argument that work to promote reading for fun in libraries can have a positive long-term pay-off.
In sum, the OECD data, even if a little old now, nonetheless provides valuable evidence of the connection between access to – and use of – libraries by school children, and enjoyment of reading.
Next week, we will look at how this translates into results in terms of literacy scores.
Find out more on the Library Map of the World, where you can download key library data in order to carry out your own analysis! See our other Library Stats of the Week! We are happy to share the data that supported this analysis on request.