Tag Archives: #LibraryStatOfTheWeek

Library Stat of the Week #43: Not everyone counted as having internet access has the speed or device needed to use it

This week and next, the Internet Governance Forum is taking place, fittingly enough, online.

This is an opportunity to return to data about connectivity in order to provide more background on the role of libraries in helping people get the most of the internet.

The Forum itself has a strong focus on the internet as a driver of inclusion. Clearly, the most immediate way of looking at this is by counting the number of people or households which do have access.

However, simply having a connection is not always enough. When this is not fast enough (for example, where it is still a dial-up connection), or where the household does not have a computer, there is less potential to realise the full potential of the internet.

Clearly, during the pandemic, this has been a major issue, with low speeds or data caps, and a lack of (enough) computers making it more difficult for people to learn, work, or apply for support.

Libraries have long provided a valuable complement to home access, offering higher connection speeds and the necessary hardware to use the internet, even in countries which are nearing 100% connectivity officially.

To get a better idea of the numbers, we look this week at Organisation for Economic Cooperation and Development data about internet access, and in particular the differences in the shares of people counted as having internet access, and those with broadband access (i.e. higher speed internet) and computers (the devices to use it).

Graph 1: When Access Doesn't Mean Access...

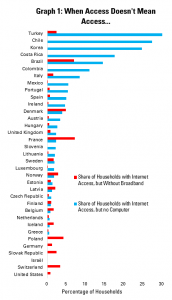
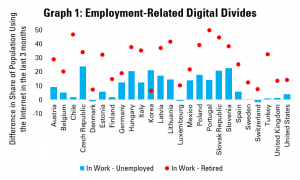
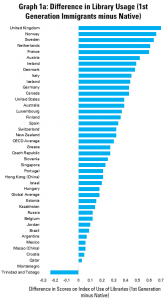
Graph 1 looks at the share of households in the overall population which count as being officially connected, but which in reality lack the key conditions to use the internet – a good quality connection and a computer.

In this graph, a longer bar indicates a higher share of households in the categories set out (connected to the internet, but not with a computer, or connected but without broadband)

In the median country, about 1 in 40 households are connected but do not have a computer, although in a number of countries, this share is much higher, reaching over 1 in 5 households in Turkey, Chile and Korea.

Meanwhile, about 1 in 100 households are connected to the internet, but do not have a broadband, but this rises to around 1 in 14 in France and Brazil.


Do these numbers stand throughout the population, or does the challenge of inadequate home internet access affect some groups more than others?

To start, it’s worth reminding ourselves of the degree to which coming from a richer or poorer household affects the likelihood of having a good internet connection and a computer.

C:\Users\stephen\Downloads\LSOTW43Graph2b.pngGraph 2b: Inequalities in Internet, Broadband, Computer Access


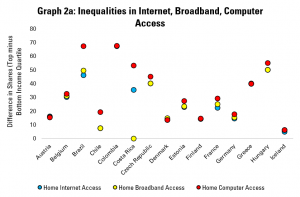
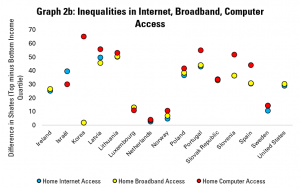
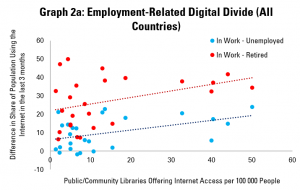
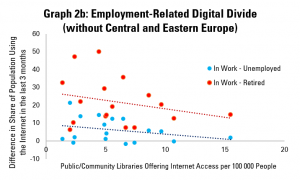
Graphs 2a and 2b do this, showing the gaps in the share of households in the top and bottom income quartiles (i.e. the richest and poorest quarters) which have internet access, broadband, or a computer.

In these graphs, each dot represents the difference in the share of richer and of poorer households having access.

These show big gaps, in particular in computer access, with a difference of over 50 percentage points between rich and poor in Brazil, Chile, Costa Rica, Hungary, Korea, Latvia, Lithuania, Portugal and Slovenia. Iceland, the Netherlands, Norway, and Sweden tend to have the lowest inequalities here.

Graph 3: Households with Internet Access, but Without Broadband

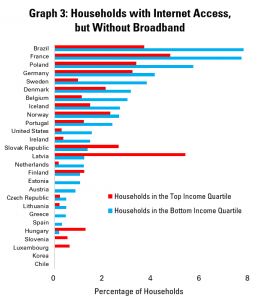
Graph 3 repeats the analysis in Graph 1, but focusing on people with ‘slow’ connections (i.e. connected but without broadband). It breaks out the figures for poorer and richer households, in order to establish whether people in poorer households are more likely to be stuck with such ‘slow’ connections than richer people.

This does appear to be the case in almost all countries. For example, in Germany, Poland, France and Brazil, over 4% of all poorer households are stuck with slower connections. This represents 5% of all those people in poorer households classed as connected in Germany, around 10% in France and Poland, and nearly 17% in Brazil.

Graph 4: Households with Connections, but Without a Computer

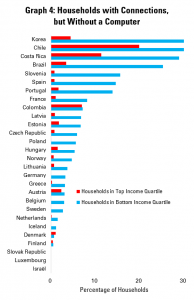
Graph 4 does the same, but looking at households which are connected, but which do not have computers. It is even clearer here that richer households are less likely to find themselves in the situation of being connected, but not having a device, than poorer households.

In Korea, Chile, Costa Rica and Brazil, over 25% of poorer households are in this situation of ‘device-less connectivity’. In effect, 2/3 of poorer Korean households which are officially connected to the internet do not have devices, while the figure is around 50% in Costa Rica and Brazil, and over 1/3 in Chile.


What lessons from this for libraries? Next week, we will combine some of this data with information about libraries offering internet access. What is does indicate, already, is that there is not only a significant issue in terms of inequality in internet access, but that even where households are officially connected, we need to look hard at whether they have the speed and devices to make this meaningful.

This is of course not to mention the more human aspects – skills, confidence, support – which may also hold people back from using the internet fully as well!

As highlighted in the introduction, libraries have a role not only in providing connectivity for the unconnected, but also a solution when this home connectivity is not good enough. As this post shows, in many countries, addressing this need is a real issue.


Find out more on the Library Map of the World, where you can download key library data in order to carry out your own analysis! See our other Library Stats of the Week! We are happy to share the data that supported this analysis on request.

Library Stat of the Week #42: Students from foreign language backgrounds rely more on libraries than their native-language peers

Over the past few weeks, our Library Stat of the Week posts have been looking at the degree to which students from different groups rely more or less on libraries.

We can gain insights into this from the results of the Organisation for Economic Cooperation and Development’s  (OECD) Programme for International Student Assessment (PISA), which in 2009 included a strong focus on libraries.

Today’s post looks at a further variable – whether students mainly speak a foreign language or the national language at home. In practical terms, in a country like the United Kingdom, we are looking at the difference in library use between children in English-speaking households, and, for example, Polish-speaking households.

This can have an impact on scores in reading and literacy, with young people with less exposure to national languages potentially struggling. Added to this is the fact that children of parents who do not speak the national language fluently cannot necessarily call on them for help with homework.

Graphs 1a and 1b therefore look at the difference in levels of library usage between these groups, expressed as the average score for students who come from households which mainly use a foreign language minus the average scores for students from households using the national language.

Graph 1a: Difference in Reading Index Scores Between Students who Speak a Foreign vs the National Language at HomeGraph 1b: Difference in Reading Index Scores Between Students who Speak a Foreign vs the National Language at Home

These demonstrate that on average, there is a gap of 0.24 points within the OECD, and 0.19 globally in favour of students from households using a foreign language, on an average that runs from -1 (no library use) to +1 (very intense library use).

The biggest gaps are seen in Hungary and the United Kingdom, although in total, 44 of the 55 for which data is available see students from foreign-language-speaking households making more use of libraries than those from national-language-speaking households.

Meanwhile, in only 10 countries do children from national-language households use libraries more than those from foreign-language households.


The data here appears to make a similar point to that made in previous posts in this mini-series – that young people who have characteristics often associated with disadvantage tend to use libraries more intensively than their peers.

Again, as before, the implication is that any moves that make access to libraries more difficult are likely to have a disproportionate impact on those who are already more at risk.


Find out more on the Library Map of the World, where you can download key library data in order to carry out your own analysis! See our other Library Stats of the Week! We are happy to share the data that supported this analysis on request.

Library Stat of the Week #40: School children without a room of their own or an internet connection rely more on libraries than their peers

Last week’s Library Stat of the Week started to explore the data available from the Organisation for Economic Cooperation and Development’s Programme for International Student Assessment (OECD PISA) regarding libraries and inequalities.

Based on a series of questions about the type of use that students (15 year olds taking part in the test) make of libraries, and how often, the PISA 2009 database provides an index of use of libraries.

By looking how different groups, on average, score on this index (running from -1 (no use) to +1 (extreme use)), it is possible to get a sense of whether there is relatively more or less dependence on libraries, according to different characteristics. As such, this provides valuable insights into how the benefits (or pain) of investment in (or cuts to) libraries may fall.

Following on from looking at differences in library usage between 15-year olds who have a 1st or 2nd generation immigrant background, as opposed to ‘native’ students, this week looks at two indicators of disadvantage – whether children have a room of their own at home or not, and whether they have household internet access or not.

Both of these are not only signs that a student may come from a less well-off background, but can also have a direct effect on their ability to benefit from education. The possibility to read and study quietly, and to make use of all that is available on the internet, are powerful.

We start by looking at differences between students who do, and do not, have a room of their own.

Graph 1a: Difference in Library Use between Students Without, and With a Room of their Own

Graph 1b: Difference in Library Use between Students Without, and With a Room of their Own

Graphs 1a and 1b do this for each country for which data is available, giving a figure for the difference in the index of library use between students who do not, and do, have a room to themselves. A bar to the right shows that students who do not have such a private space make more use of libraries than students who do, while a bar to the left shows the contrary. The longer the bar, the bigger the difference.

Overall, it shows that in OECD countries, students who do not have a room for themselves score 0.15 points higher on average on the library usage index, while globally, the figure is 0.07. The biggest differences are to be seen in Scandinavian countries, as well as the Netherlands and Germany.

In 38 countries, students without a room of their own make more use of libraries than those who don’t. In 19 countries, it is the other way around, while in 3, there is no difference.

Graph 1c: Difference in Library Use and Average PISA Reading Scores

Graph 1c looks at whether there is much difference in this level of reliance on libraries depending on overall average reading scores. As in last week’s post, there appear to be two groups of countries – with richer countries which tend to score higher in blue, and developing countries tending to score lower in green.

Within each group, however, there is little correlation between the level of reliance on libraries by students without rooms of their own, and overall reading scores. In other words, it seems not to matter much whether a country is a high or low performer overall – those who are disadvantaged continue to make strong use of libraries.

Graphs 2a and 2b replicate the analysis in Graphs 1a and 1b, but rather comparing scores for library use between students who do not, and who do, have internet access at home.


Graph 2a: Difference in Library Use Scores between Students Without and With Home Internet Access

Graph 2b: Difference in Library Use Scores between Students Without and With Home Internet Access

The differences here are even stronger, with an OECD average difference of 0.23 and a global average of 0.17, illustrating that globally children without home internet access rely more heavily on libraries than those who don’t.

In 48 countries out of 59, libraries appear to be more important for children without home internet access than for those with it, while only in 11 do children with internet access at home make more use of libraries than those who don’t. Interestingly, the countries with the highest differences in usage are different to the ones which come top when looking at students with rooms of their own.

Graph cc: Difference in Library Use and Average PISA Reading Scores

Graph 2c then repeats the same logic as Graph 1c, looking at whether there is any reason to believe that the connection between lack of a home internet connection and library use is stronger or weaker depending on overall literacy scores.

The result – as in the case of Graph 1c – is that there is no clear connection, either in the group of lower performers or the group of higher performers. In other words, it does not matter much how well a country performs overall on literacy, library use tends to be higher among students without an internet connection at home.


The overall conclusion of this blog is that the evidence indicates that, in general, students who face barriers to benefitting from education due to their home environment tend to rely more on libraires. The corresponding argument is then that when library services are cut back, the pain will be higher for those who already have fewer resources or options.

Next week’s post will look at another dimension of inequality – the highest level of education achieved by parents.


Find out more on the Library Map of the World, where you can download key library data in order to carry out your own analysis! See our other Library Stats of the Week! We are happy to share the data that supported this analysis on request.

Library Stat of the Week #39: Globally, 1st and 2nd generation immigrant students make more intensive use of libraries than their native peers

One of the most worrying aspects of the COVID-19 pandemic and its consequences has been the deepening of the educational divide.

As highlighted in the Gates Foundation’s Goalkeepers report, there is a significant risk that the closure of school buildings will increase inequalities. In effect, groups that previously faced risks of worse educational outcomes face an even higher risk now.

While it is difficult to gather statistics on what is happening already, we can at least look back at available data to understand what factors might contribute to combatting this inequality. This can provide a basis for planning for the recovery afterwards.

Fortunately, the dataset from the Organisation for Economic Cooperation and Development’s Programme for International Student Assessment (OECD PISA) 2009 offers insights here.

We have already been able, in previous posts, to note the connection between access to a library and enjoyment of reading, and library availability and literacy skills.

This post looks to understand the connections between library use and just one potential vector of inequality – immigrant status.

As part of its data collection, as well as measuring levels of literacy and asking questions about library use, PISA 2009 also asked if the 15-year olds involved were first or second generation immigrants, or ‘native’ (i.e. all others). This allows us then to look at how far immigrant children, and the children of immigrants, depend on libraries.

Graph 1a: Difference in Library Usage (1st Generation Immigrants minus Native)

Graph 1a looks at the situation for 1st generation immigrants, providing for each country a figure for the difference between immigrant and ‘native’ 15 year olds in terms of scores on the index of library use compiled by the OECD. This index is made up of figures related to how often students borrow books – for work or pleasure – or use the library in other ways, and runs from -1 to 1.

In the graph, a longer bar to the right indicates that 1st generation immigrant students use the library more intensively than natives. A bar to the left indicates that they use it less.

Overall, the conclusion is clear – in all but two countries, 15-year olds with a 1st generation immigrant background make much stronger use of libraries than native peers.

Graph 1b: Difference in Library Usage (1st Generation Immigrants minus Native)

Graph 1b replicates this analysis, but comparing 2nd generation immigrant students to ‘native’ students. While the effect is less strong, only 9 of the 43 countries for which data is available see 2nd generation immigrant students use libraries less than native students.

In both graphs, the United Kingdom and Norway share the top spots in terms of how much more immigrant students use libraries than natives.

These graphs also send a clear signal – libraries tend to be better used by students who can risk otherwise being left behind. It follows that any reduction in the possibility to use libraries is more likely to hurt students from immigrant backgrounds.


Graphs 1a and 1b allow us to look at individual countries. What about overall trends, for example when we compare these figures with how students perform in general on literacy, or how much native students use libraries?

Graph 2: Difference in Levels of Library Use (1st/2nd Generation Immigrants vs Native) Compared with Overall Reading Scores

Graph 2 looks at the first of these questions, comparing the difference in library usage between 1st/2nd generation immigrant students and native peers (horizontal axis) and average scores for literacy for the whole population (vertical axis). Each dot represents a country.

Overall, there appears to be a positive correlation, with higher gaps in levels of library usage between immigrants and natives leading to higher overall reading scores.

In reality though, it perhaps makes more sense to see the countries presenting as falling into two groups – one of higher performers (usually richer countries) in the top right, and a group of less developed ones in the cluster in the middle-left.

In each of these groups, there is in fact little correlation between differences in library use and overall reading scores.

The lesson from this is then that the value of libraries to immigrant students does not depend on how well a country is performing in general – libraries seem to matter in both cases.

Graph 3: Difference in Levels of Library Use (1st/2nd Generation Immigrants vs Native) Compared with Native Library Use

Graph 3 repeats this, but this time, the vertical axis looks at levels of library use among native students. Here, there is a more obvious correlation, with differences in library usage higher in situations where native students are using them less.

To some extent, this is logical – if natives use libraries less, and immigrants use them to the same extent, of course the gap will be higher.

In policy terms, however, the implication is that even where there is less use of libraries by native students, they continue to be important to immigrant students.


As highlighted last week, there appears to be a strong link in almost all countries surveyed between library use and scores in the literacy component of PISA.

This week’s statistics indicate that, in turn, 1st and 2nd generation immigrant students tend to be more intensive library users than their native peers. This connection tends to hold, regardless of the overall level of literacy in the population, and even when native students use libraries less.

While of course correlation cannot be taken for causality, the data here supports the argument that ensuring access to libraries will be an important part of any effort to close the education divide.


Find out more on the Library Map of the World, where you can download key library data in order to carry out your own analysis! See our other Library Stats of the Week! We are happy to share the data that supported this analysis on request.

Library Stat of the Week #37: The connection between having access to a library and enjoyment of reading is strongest among children in Austria, France and Montenegro

Last week’s Library Stat of the Week looked at the connection between numbers of school libraries and levels of enjoyment of reading, combining data from IFLA’s Library Map of the World and the OECD’s PISA study.

As highlighted, simply counting the number of students per school library has limits as an indicator of the strength of the sector, as it depends heavily on the structure of schools as a whole.

It also does not account for the number of staff. As we have seen with public libraries in various previous posts, numbers of public and community library workers tend to be more closely linked to positive outcomes, such as literacy and equality.

An alternative perspective can come from digging deeper into the OECD’s PISA data. There is in fact a wealth of information specifically about libraries, based on their 2009 survey.

This post will therefore be the first of a series looking into the lessons we can gain from this source. Picking up on last week’s theme, this week’s blog looks at the links between students’ access to libraries – and use of them – and their level of enjoyment of reading.

As highlighted last week, this matters, as enjoyment of reading in turn is associated with higher overall reading performance.

Graphs 1a and 1b look at the data on the difference in level of enjoyment of reading between students who do, and do not have access to a library.

Graph 1a: Difference in Enjoyment of Reading Between Children With and Without Library Access

Graph 1b: Difference in Enjoyment of Reading Between Children With and Without Library Access

Given the number of countries, it is divided into two graphs, with countries organised according to the gap in levels of enjoyment of reading – the first graph shows countries where the difference in levels of enjoyment is highest.

We can therefore see that this is highest in Austria, Taiwan (China), France and Montenegro. In almost all countries, those who have libraries tend to enjoy libraries more than those don’t.

There are some exceptions though. Yet simply having a library does not mean that it is used. In order to dig further, it makes sense to look at how different types of library use are linked with enjoyment of reading.

Graphs 2a and 2b therefore look at the connection between how regularly 15-year-olds borrow books for fun, and their level of enjoyment of reading.

Graph 2a: Library Borrowing for Pleasure and Level of Enjoyment of Reading


Graph 2b: Library Borrowing for Pleasure and Enjoyment of Reading
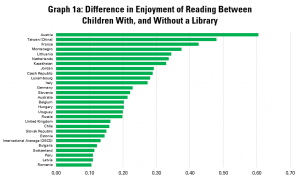
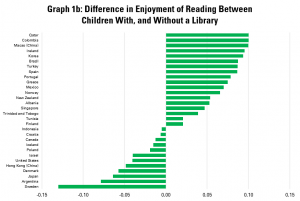
These graphs indicate levels of enjoyment of reading amongst 15-year olds who borrow books only once a month, compared to those who do so never, and those who do so several times a week.

In these graphs a longer blue line to the left indicates that there is a bigger gap in enjoyment of reading between occasional borrowers (once a month) and those who never read. A longer red line to the right indicates a bigger gap in enjoyment between very regular borrowers (several times a week) and occasional ones (once a month).

It is not a surprise of course that there is a connection between the two here – in every country, those who borrow more enjoy reading more. Interestingly, in general, the gaps are bigger between occasional library borrowers and those who never borrow, rather than between the more frequent and the occasional borrowers.

It is in Finland, Germany, Austria and Switzerland where the links between regularity of borrowing books and enjoyment of reading are strongest. The implication here is that building up a habit of library borrowing can correlate with enjoyment of reading.

Graph 3a: Library Use for Homework and Enjoyment of Reading


Graph 3b: Library Use for Homework and Enjoyment of Reading
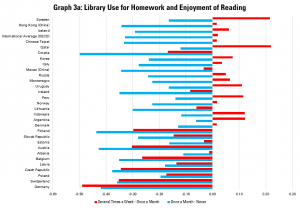
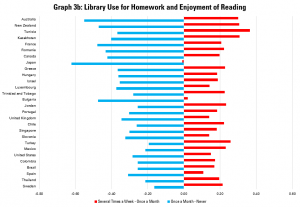
Graphs 3a and 3b look at the links between levels of enjoyment of reading and how often students use the library to carry out homework.

In these graphs a longer blue line to the left indicates that there is a bigger gap in enjoyment of reading between those who occasionally use the library to do homework (once a month) and those who never do. A longer red line to the right indicates a bigger gap in enjoyment between very regular users of the library for homework (several times a week) and occasional ones (once a month).

As can be expected, the difference between level of enjoyment of reading between those who use libraries to do homework regularly, and those who don’t, are less marked than in the previous example.

Nonetheless, the connection is positive in all but one country, suggesting that having library spaces which are suitable for children to do homework is associated with more positive attitudes toward reading. Australia and New Zealand see the most positive connections in this regard.

Graph 4a: Reading for Fun at the Library and Enjoyment of Reading


Graph 4b: Reading for Fun at the Library and Enjoyment of Reading
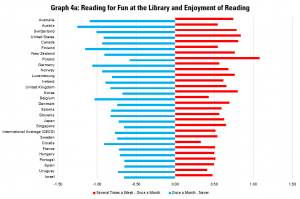
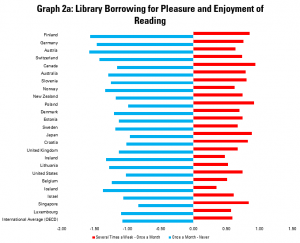
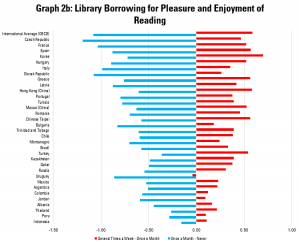
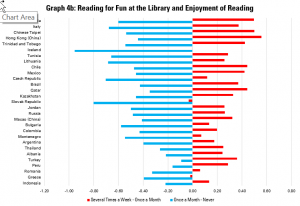
Finally, graphs 4a and 4b look at the links between enjoyment of reading and using the library to read for fun. Again, it is expected that more regular reading for fun at the library is linked to greater enjoyment of reading in general.

In these graphs a longer blue line to the left indicates that there is a bigger gap in enjoyment of reading between those who occasionally use the library to read for fun (once a month) and those who never do. A longer red line to the right indicates a bigger gap in enjoyment between very regular users of the library to read for fun (several times a week) and occasional ones (once a month).

In every country, the link is positive. As with borrowing of books, it also seems that there are bigger gaps between those who visit occasionally and those who never visit, than between the most regular users and more occasional ones.

Again, Australia, followed by Austria, Switzerland and the United States, has the most dramatic links between reading for fun at the library and enjoyment of reading overall.

This would support the argument that work to promote reading for fun in libraries can have a positive long-term pay-off.


In sum, the OECD data, even if a little old now, nonetheless provides valuable evidence of the connection between access to – and use of – libraries by school children, and enjoyment of reading.

Next week, we will look at how this translates into results in terms of literacy scores.


Find out more on the Library Map of the World, where you can download key library data in order to carry out your own analysis! See our other Library Stats of the Week! We are happy to share the data that supported this analysis on request.

Library Stat of the Week #36: Where there are more school libraries, children enjoy reading more

The Gates Foundation’s Goalkeepers 2020 report, published earlier this week, highlights the risk that literacy could suffer as a result of the COVID-19 Pandemic.

It presents different projections, suggesting that the share of children finishing primary school with the ability to read and understand a basic text could fall back to 2015, or even 2010 levels.

This has important knock-on effects, with children then struggling to engage with other subjects at school, achieving less, and finding it harder to integrate into the labour market later in life.

A key determinant of literacy, as underlined in the OECD’s Programme for International Student Assessment (PISA) is enjoyment of reading outside of school. In turn, a key argument made in library advocacy is that our institutions – both public, and embedded in schools, can help build a love of reading.

There have been a good number of studies exploring the connection between school libraries and reading performance at the local level. But what does the data say at the global level?

To explore this, we have brought together information from the IFLA Library Map of the World, as well as OECD PISA data, which used surveys of students alongside tests to find out about habits related to reading.

Graph 1, as a first step, looks at average levels of enjoyment of reading among 15 year olds in participating countries, based on data for 2018. The higher (more positive) a bar is, the more children in the country, on average, report enjoying reading.

Graph 1: Enjoyment of Reading (OECD PISA)

This underlines strong variation between countries, with 15 year olds in Turkey, Kazakhstan, Peru and Indonesia displaying the highest level of enjoyment of reading, while those in Denmark, Croatia and Sweden were less keen.

It is worth noting that total figures, as displayed here, cover varying levels of enjoyment within populations (and indeed, it is on this basis that the OECD can show links between enjoyment and literacy).

Graph 2 turns to the number of school libraries per student. Combining UNESCO Institute for Statistics data with that from the IFLA Library Map of the World data, we can work out how many school libraries there are for every 1000 children enrolled in primary or secondary schools.

Graph 2: School Libraries per 1000 students

For countries for which we have data, there are an average of 1.81 school libraries per 1000 students. Within this, there is strong variation, with the largest number of school libraries per student being found in Poland, Georgia, Moldova and Ukraine.

Graph 3 brings this data together, with numbers of school libraries per 1000 students on the horizontal (X) axis, and the enjoyment of reading index on the vertical (y) axis.

Graph 3: School Libraries per 1000 Students and Enjoyment of Reading

This indicates a positive correlation between numbers of school libraries and enjoyment of reading, demonstrated by the gently rising line. This indicates that in general, where there are more school libraries, enjoyment of reading.

Clearly, however, there are limitations to this finding. First of all, not all countries operate with school libraries, with public libraries taking up their role. And of course, having more school libraries may be part of a wider strategy to promote reading, including through different techniques for promoting this.

They may also organise schools differently, with larger or smaller institutions, which will affect the number of libraries per student. Finally, data on school library workers is limited, meaning that is it not possible to carry out analysis using this.

Future editions of Library Stat of the Week will dig deeper into the available data on school (and public) libraries, and results from OECD’s work on reading habits and performance among children.


Find out more on the Library Map of the World, where you can download key library data in order to carry out your own analysis! See our other Library Stats of the Week! We are happy to share the data that supported this analysis on request.

Library Stat of the Week #35: Where there are more libraries offering internet access, being out of work is less likely to mean that people are also offline

Over the past weeks, we have looked at data around digital divides, and to what extent these cross over with other potential divides in society – rich and poor, women and men, old and young, and those with higher or lower formal qualifications.

It is valuable to look at this because the results help understand to what extent the internet can act as a bridge across divides, or rather deepen them further.

Ideally, access to the web should help those who are disadvantaged find new opportunities and information in order to improve their own lives, as well as those of the people around them.

However, where access is lacking, the fortunate – those who can use the internet – can get ahead, while those without drop further and further behind. This has been abundantly clear during the COVID-19 pandemic, with children lacking internet access unable to take part in education in the same way as their better connected peers.

It is also the case for those facing unemployment. People seeking work can do so much more easily with access to the internet, both to find openings, and to develop skills or access support.

People who are retired can also risk being cut off without internet access, for example limiting contact with friends and family, governments services, and eHealth possibilities. Older people may also feel less confident online, and feel the need for additional support.

In both cases, libraries can provide a great way to ensure that everyone can get online and make the most of the internet.

This blog therefore looks at digital divides between those in work on the one hand, and those who are unemployed or retired on the other. Once again, data on internet use comes from the OECD’s database on ICT Access and Usage by Households and Individuals, while data on libraries offering internet access comes from IFLA’s Library Map of the World.

Graph 1: Employment-Related Digital Divides

Graph 1 looks at the state of the employment-related digital divide, for countries for which data is available. In almost all countries, a greater share of people in employment have used the internet in the last three months than those who are unemployed.

Only Denmark, Luxembourg and Switzerland buck the trend. In the Czech Republic, Hungary, Korea, Slovenia and Slovakia, the gap is over 20 percentage points.

Meanwhile, in no country are retired people more likely to use the internet than people in work, with the gap reaching over 40 points in Chile, Lithuania, Portugal and the Slovak Republic.

Graph 2a: Employment-Related Digital Divides and Internet Access in Public Libraries (All Countries)

Graph 2a crosses these figures with those for the number of public or community libraries offering internet access. Each dot represents a country, with the number of public or community libraries offering internet access on the horizontal (X) axis, and the gap in shares of the population using the internet (employed minus unemployed (blue dots) or retired (red dots)) on the vertical (Y) axis.

As with previous weeks, putting together the figures for all countries suggests that there is a positive correlation between the number of libraries offering internet access per 100 000 people, and the size of the digital divide – clearly not an encouraging result!

However, as we have seen in previous weeks, it is worth breaking out the results for Central and Eastern Europe, given the particular history of these countries

Graph 2b: Employment-Related Digital Divides and Internet Access in Public Libraries (without Central and Eastern Europe)

Graph 2b – using data from countries outside of Central and Eastern Europe – therefore shows a very different picture, in line with what we have seen in previous weeks. Where there are more libraries offering internet access, the digital divide faced by people who are out of work or retired, compared to their in-work peers, tends to be smaller.

Indeed, it appears that for every additional public library per 100 000 people offering access, the digital divide for the retired falls by 1 percentage point, and that for the unemployed falls by 0.55 percentage points.

Graph 2c: Employment-Related Digital Divides and Internet Access in Public Libraries (Central and Eastern Europe)

Graph 2c repeats the analysis for countries in Central and Eastern Europe for which we have data, again indicating that where there are more libraries offering internet access, divides are smaller.


As always, the analysis carried out here cannot show causality – only correlation. However, it supports the argument that it is in societies with more libraries offering internet access that people who most need to access the internet face smaller barriers to doing so.

With COVID-19 risking exacerbating divides in societies, this is a powerful point to make in underlining why maintaining and broadening internet access through libraries matters more than ever.


Find out more on the Library Map of the World, where you can download key library data in order to carry out your own analysis! See our other Library Stats of the Week! We are happy to share the data that supported this analysis on request.