Tag Archives: #LibraryStatOfTheWeek

Library Stat of the Week #34: Where there are more public libraries offering internet access, people with fewer formal qualifications face a smaller digital divide

In the last couple of posts, we have looked at the relationship between the availability of public libraries offering internet access and digital divides.

Using data from the Organisation for Economic Cooperation and Development (OECD), we have looked at gaps in levels of internet use among richer and poorer households, between older and younger people, and between women and men.

In each case, it appears that where there are more public libraries offering internet access, these gaps are smaller.

This week’s post looks at digital divides between people with lower and higher levels of formal education.

Clearly, education is often a key determinant of economic success later in life. Yet not everyone has the possibility to gain qualifications early on, for a variety of reasons. What is important then is to have a second chance – an opportunity to learn in other ways, and even gain qualifications.

We have already shown that societies with more public library workers tend to have higher shares of adults in general engaged in lifelong learning (Library Stat of the Week #20). This also highlighted that in general, where there are more public library workers, the gap in rates of participation in lifelong learning between the high- and low-educated is less.

The internet is a key way of finding and accessing learning opportunities. Especially during COVID-19, but clearly also before, online learning has become more and more important.

Therefore, looking at the digital divide between those with high and low levels of education (i.e. the difference in percentages accessing the internet at least once in the last 3 months), we can also build up a sense of whether libraries may be helping ensure that those with fewer qualifications are getting a second chance.

Once again, data on internet use comes from the OECD’s database on ICT Access and Usage by Households and Individuals, while data on libraries offering internet access comes from IFLA’s Library Map of the World.

Graph 1: Education-Related Digital Divides

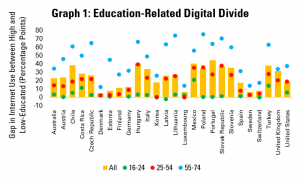
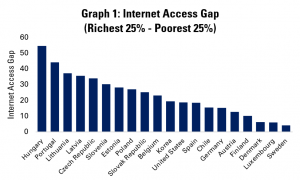
Graph 1 looks at the state of the education-related digital divide in general. Looking at the population as a whole, some countries demonstrate dramatic differences.

For example, there is a gap of over 40 percentage points in levels of internet use among people with high and low levels of formal education in Hungary, Mexico and Portugal. It is only in Denmark, Estonia, Luxembourg, Sweden and Switzerland where the gap is smaller than 10 percentage points.

In every single country, the gaps are wider among people aged 55-74 than among younger generations. Gaps are also wider among 25-54 year olds than among 16-24 year olds in every country except Luxembourg.

The size of gaps matters, and arguably more among older workers. In general, it can be more difficult for older workers to find new jobs if they become unemployed. The internet can help address this, if it is available.

More broadly, this raises the possibility that not only does having less formal education mean that people are less likely to be internet users, but that in turn, difficulties in accessing the internet may stand in the way of efforts to find and make use of opportunities to improve lives, creating a vicious circle.


Graph 2a: Education-Related Digital Divides and Public Internet Access in Libraries (All Countries)

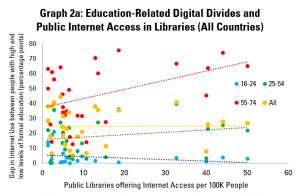
Graph 2a compares these figures (including broken down by age group) with those for the number of public libraries per 100 000 people offering internet access.

The finding is not necessarily encouraging – where there are more public libraries, the gaps are wider. However, this is also in keeping with previous analyses when we have looked at Central and Eastern Europe (which has its own particular history) and all other countries together.

Graphs 2b and 2c look at the ‘rest of the world’ and Central and Eastern Europe separately.

Graph 2b: Education-Related Digital Divides and Public Internet Access in Libraries (without Central and Eastern Europe)

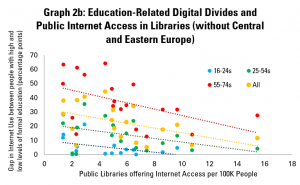
Graph 2b – looking at all countries for which data is available, except those in Central and Eastern Europe – shows a correlation between having more libraries offering internet access, and smaller digital divides.

Indeed, it appears that on average, for every 1 extra public library per 100 000 people offering internet access, the digital divide drops by 1.7 points. Looking only at the digital divide among older people, the divide shrinks by 2.2 points.

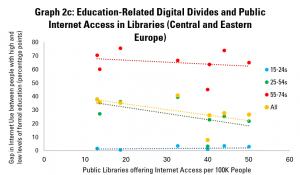
Graph 2c looks at Central and Eastern Europe in particular, and finds similar conclusions, at least for people aged 25 and above, and for the population as a whole. Once again, where there are more public libraries offering internet access, the education-related digital divide is smaller.


As we underline in almost all of these posts, correlation does not mean causality. It is of course possible that the sort of society that invests in libraries also invests in the sort of minimum income support that ensures that everyone has a good chance of being able to buy a computer and internet connection.

Nonetheless, sample-based work, as well as anecdotal evidence, does suggest that libraries can provide a vital opportunity for those with fewer resources to get online, and access second chances – for education, employment, and simply personal fulfilment.

The results presented here do support the argument that libraries can help prevent the digital divide becoming a vicious circle.

Next week, we’ll be looking at the digital divides that exist between people who are in work, and those who are unemployed, or retired.


Find out more on the Library Map of the World, where you can download key library data in order to carry out your own analysis! See our other Library Stats of the Week! We are happy to share the data that supported this analysis on request.

Library Stat of the Week #32: More can be done to close the digital access gap through public libraries

Libraries were often early adopters of digital technology, both for their own internal operations, and in support of their users.

By installing computer terminals and allowing for public access, they have given millions their first taste of the internet, in an environment where they could feel comfortable and supported in trying something new.

It is also well understood that that libraries can play a key role in bringing the unconnected online through providing this sort of public access. In some cases, this can act as a stepping stone towards private access, in others, an essential backstop for those unlikely ever to get a connection or device at home.

Frequently, those in the greatest need of this support are the poorest members of a society, who may not be able to commit to regular monthly payments, either for fixed or mobile internet. Instead, they can be stuck with pay-as-you-go options which end up more expensive.

This blog, the first in a sub-series, therefore looks at the connections between the digital access gap and the presence of libraries offering internet access. It draws on OECD statistics on internet access and usage for households and individuals, and IFLA’s own Library Map of the World.

First of all, it is worth understanding the scope of the challenge. Graph 1 indicates the differences in internet access rates (use of the internet in the past three months) between people from households in the first (poorest) and fourth (richest) quartiles of the population.

Graph 1: Internet Access Gap (Richest 25% - Poorest 25%)

In this, only three countries – Denmark, Luxembourg and Sweden have a gap of less than 10 percentage points. Meanwhile, in Hungary, the gap is almost 55 percentage points – nearly 92% of people from richer households have accessed the internet, but barely 37% of those from poorer ones.

Interestingly, only one of the nine countries with the biggest gaps does not belong to the former Eastern bloc – we will return to this point later.

Graph 2: Public/Community Libraries Offering Internet access per 100 000 people
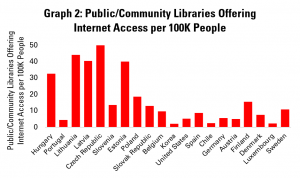
Graph 2 displays (with the same order of countries as before) the number of public and community libraries offering public internet access per 100 000 people. The Czech Republic scores highest here, with just over 50 such libraries for every 100 000 people – that’s one for every 20 000 citizens.

Lithuania and Latvia also have more than 40 public libraries offering internet access per 100 000 people, and Estonia is only a short way behind.

Again, it is noticeable that most of the countries with high numbers of libraries offering internet access are from former Eastern Bloc countries.

Graph 3: Library Internet Provision and Access Gaps
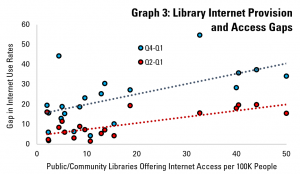
We can cross these figures in Graph 3, which aims to look at the relationship between income-related internet access gaps and the availability of libraries offering access.

This shows a correlation between the number of libraries offering access and the gap in access between rich and poor. This applies both for the difference between the richest 25% and the poorest 25% (4th quartile minus 1st quartile), but also between those roughly in the middle and those at the bottom (2nd quartile minus 1st quartile)

On the one hand, this suggests that there is – fortunately – the infrastructure in place in order to help bridge this divide. The challenge, then, is to ensure that the possibilities that libraries provide turn into smaller access gaps in reality.

Graph 4: Library internet provision and access gaps (without Central Europe)
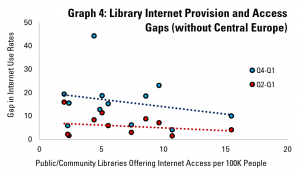
As an additional step, Graph 4 carries out the same analysis, but not including countries from the former Eastern bloc.

Here, in fact, we can see that the correlation goes in another direction, suggesting that having more libraries offering internet access tends to be associated with a smaller gap between rich and poor in terms of internet access.


The analysis presented here raises interesting questions – what more can be done to realise the potential of connected libraries to close the gap between rich and poor in terms of internet access in countries of the former Eastern bloc? Can we take the more positive correlation between equality and the existence of libraries elsewhere as a positive?

Next week, we’ll explore the same question from different angles, including age and level of education.


Find out more on the Library Map of the World, where you can download key library data in order to carry out your own analysis! See our other Library Stats of the Week! We are happy to share the data that supported this analysis on request.

Library Stat of the Week #31: Where there is more librarian support, the share of women completing degrees compared to men is higher

In last week’s Library Stat of the Week,  we looked at the relationship between the number of librarians per student and per researcher, and rates of completion of studies and publication per researcher respectively.

This week, we dig a little deeper into the first of these two questions by using gender dis-aggregated data for completion rates from the OECD.

In effect, this allows us to understand whether greater levels of academic or research librarian support for students (calculated by the number of students each librarian serves) can be associated with a more or less favourable gender gap for women.

Graphs 1, 2 and 3 do this for students at bachelor’s, masters and doctoral levels respectively. In each graph, each dot represents a country for which data is available.

On the horizonal (X) axis, there is the number of students per librarian. Countries which are more to the left have fewer students per librarian (a proxy for better librarian support), while those on the right have more students (and so less librarian support).

On the vertical (Y) axis, there is the result of subtracting the completion rate for women from the completion rate for men. A figure above zero indicates that a greater share of men complete their studies than women, while a figure below zero suggests that more women finish than men.

Graph 1: Bachelors Degree Completion Gap


Graph 2: Masters Degree Completion Gap

Graph 3: Doctoral Degree Completion Gap
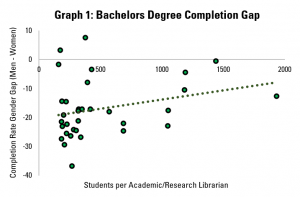
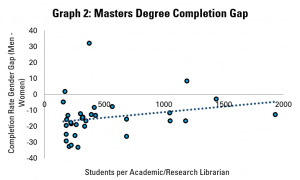
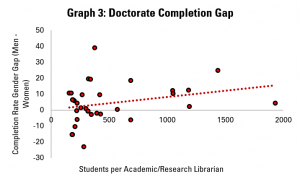
Across the three graphs – and so at all levels of study – it appears that where there is greater level of support from librarians (i.e. each librarian has fewer students to support), the gender gap is more favourable to women.

In terms of the strength of the relationship, it is relatively similar across the levels, with the closest correlation seen at doctoral level (which may make sense, given the intensity of research required for this).

Outside of library support, it is noticeable that while the gender gap tends to favour women at bachelors and masters level, more men tend to complete their doctorates than women.

As part of any gender equality strategy, efforts to ensure that more women get the qualifications needed to get into the highest skilled jobs are likely to play a key role. At the doctoral level, there is clearly work to be done. It could be worth looking further at the role that stronger libraries services can play in ensuring that women get the support needed to complete their studies at this level.


Find out more on the Library Map of the World, where you can download key library data in order to carry out your own analysis! See our other Library Stats of the Week! We are happy to share the data that supported this analysis on request.

Library Stat of the Week #30: Countries with more librarians per student tend to have higher completion rates

In last week’s Library Stat of the Week, we explored in more depth the relationship between numbers of students and researchers as a share of the population, and numbers of academic and research librarians available to support them.

This helped to highlight the variation that exists between countries, and in particular which ones manage to combine a strong student or research sector with adequate librarian support.

Having figures for the number of students and researchers allows us to look at potential relationships between the level of library support they receive (calculated in terms of the number of students or researchers an individual academic or research librarian serves) and outcomes.

Therefore, in this week’s Library Stat of the Week, we will be using, for the first time, OECD data on tertiary education completion rates (as a measure of whether students receive the support necessary to finish their courses), and publishing and patenting data, as used in previous editions.

Graph 1: Academic/Research Library Workers per Student and Student Completion Rates

Graph 1 looks at completion rates (from OECD data, for students at all levels) and compares these with previously calculated figures about the number of students each librarian serves on average.

It finds a small, negative correlation between the two – in other words, the more students an academic/research librarian needs to serve, the lower the likelihood of the student completing their studies.

Clearly, other factors also play out – the OECD itself notes that where courses are shorter, completion rates are higher, and of course student financing also plays a role.

Nonetheless, while of course this sort of analysis cannot show causation, it does indicate that where students have greater access to librarians, they are more likely to complete their courses.


Turning to research, our previous posts looking at the relationship between libraries and innovation were based on numbers of academic/research library workers in the population as a whole.

This, while showing that more librarians tended to mean more publications and more patents, had the weakness of neglecting indicators of the strength of the research field as a whole.

To remedy this, we can now use figures from the last two weeks which calculate the number of researchers each academic/research library worker has to serve, giving a much better idea of whether more (or less) library support for research correlates with outcomes in terms of publications and patents.

Graph 2: Academic/Research Library Workers per Researcher and Publications per Researcher

Graph 2 does this for publications, looking at whether researchers with more academic library support tend to publish more. To do this, we created a measure of number of publications per researcher by dividing figures for numbers of publications (World Bank) by those for the number of researchers (OECD).

The graph does indeed show this – when each academic/research library worker has fewer researchers to serve, the researchers tend to publish more articles each.

Graph 3: Academic/Research Library Workers per Researcher and Patents per Researcher

Graph 3 performs the same exercise for patents, using a figure for patents per researcher calculated again using World Bank and OECD data.

As with publications, this again shows a correlation, with countries where each academic or research library worker needs to serve fewer researchers each, on average, having higher rates of patenting per researcher.


As ever, correlation is not causation, although the analysis here does allow us to focus more precisely on the relationship between the strength of the academic and research library field and innovation performance per country.

While further research would be needed in order to demonstrate direct causality, these figures do allow us to say that those countries which provide stronger library support to students and researchers (as measured by numbers of students or researchers per academic and research library worker) tend to have higher student completion rates, and higher rates of publishing and patenting per researcher.


Find out more on the Library Map of the World, where you can download key library data in order to carry out your own analysis! See our other Library Stats of the Week! We are happy to share the data that supported this analysis on request.


Library Stat of the Week #29: Mexico, Slovakia and Lithuania have high numbers of academic librarians both per student and per researcher

Last week’s Library Stat of the Week looked at how many researchers and students each academic or research library worker had to serve.

A point mentioned in the conclusions was the fact that from one country to the next (and indeed, from one institution to the next), there may be more focus on teaching students or on carrying out research.

Similarly the work of libraries can vary, for example, from helping undergraduates develop information literacy skills, to helping post-graduates manage datasets and find effective venues for publication.

We can get a little more insight into this question by comparing the numbers of students and researchers per academic or research librarian – effectively the figures from Graphs 2a and 2b of last week’s post.

The results of this are shown in Graph 1.

Graph 1: Students and Researchers per Academic/Research Librarian

This gives a degree of insight into the different communities that libraries are serving. Using the global average (World) as a reference point, we can assess in which countries academic library workers serve more (or less) students or researchers than average.

Those countries in the bottom left part of the graph are where there are relatively low numbers of students and of researchers per librarian. Therefore, in Slovakia, Mexico and Costa Rica, it is possible to see that students and researchers are relatively well served.

In the top left box, we see countries where there are a relatively low number of students per librarian (implying more possibility to provide services), but a higher number of researchers per librarian. In the bottom right, it is the inverse, with few researchers, but more students per librarian.

Finally, in the top right box, we have those countries where the average librarian has to support an above-average number of students or researchers.

Another point highlighted in last week’s blog was the fact that to some extent, the number of librarians per researcher or student is of course influenced by the number of researchers or students overall in the population.

Graphs 2 and 3 explore this further by comparing numbers of students and researchers per academic library worker with the number of students and researchers per 100 people.

Graph 2: Students per 100K, and per Academic/Research Library Worker

Graph 2 starts by looking at the situation for students, and once again uses the world averages (across available data) as a reference point.

Countries in the bottom right hand box combine both a high number of students and a high number of librarians per student (or low number of students per librarian). We can conclude, then, that students in Mexico, Chile, Germany and Lithuania are both numerous and well served.

In contrast, countries in the top left hand box have both relatively few students and fewer librarians per student. Countries in this situation include Japan, Latvia and New Zealand.

The bottom left hand box is for countries with few students, but a strong library service, while in contrast, those in the top right have a big tertiary education sector, but relatively few librarians to serve it.

Graph 3: Researchers per 100K People and per Academic/Research Library Worker

Graph 3 looks at researchers, following the same principle. On this graph, countries in the bottom right hand box are those which have both a strong research population, and lots of librarians to serve it. Countries in this situation include New Zealand, the United Kingdom, the United States, Slovenia, Germany, Japan, Finland and Sweden.

In contrast, countries in the top left-hand box have both few researchers and few librarians there to support them. This is the case for Hungary and Italy.

Finally, the bottom right-hand box is for countries with a relatively small research community (but one that is well supported), and the top left for countries with larger numbers of researchers, but lower levels librarian support.


The figures shared in this post have allowed us to build up a more detailed sense of the size of academic and library research fields compared to the communities that they support. Next week, we will return to figures on publications and look at tertiary education completion rates.


Find out more on the Library Map of the World, where you can download key library data in order to carry out your own analysis! See our other Library Stats of the Week! We are happy to share the data that supported this analysis on request.

Library Stat of the Week #28: On average, there are 305 students and 20 researchers per academic library worker

In recent weeks, we have looked at how numbers of academic libraries and library workers stand around the world, and what correlations there are between these, in relation to total populations, and indicators of innovation such as publishing and patenting.

Another angle worth exploring is the relationship between numbers of academic library workers, and those who benefit most directly from their services – students in tertiary education and people working in the research sector.

We can start to explore this by looking at data from the UNESCO Institute for Statistics on numbers of people working in research, and OECD data on the number of people registered in tertiary education, combined with data from IFLA’s Library Map of the World.

In each case, there is not data available for every country. In particular, OECD data is focused on its own members, with a few additional countries, meaning that averages offered are only relative to a part of the world.

Graph 1: Number of Students per Academic and Research Library Worker

Graph 1 looks at students. Students can benefit strongly from well-supported academic libraries, in order to help them benefit from well-designed collections, find resources effectively, and develop key skills.

The data available indicates that on average, each full-time academic library worker serves 207.7 students. The smallest number of students per librarian was in Germany – 157.6, with eight countries in total coming below the global average, of which seven are European, and the other is Canada.

Among other regions for which data is available, Colombia had the smallest number of students per librarian in Latin America and the Caribbean, and Japan in Asia-Oceania. There are some very high figures for numbers of students in some countries, which may be due to under-counting.

Graph 2a: Number of Researchers per Academic and Research Library Worker


Graph 2b: Number of Researchers per Academic and Research Library Worker

Graphs 2a and 2b look at research personnel (to note different scales on the vertical axis). As has been underlined in previous posts, libraries are a key part of the research infrastructure for any country, not only ensuring that researchers can access knowledge and ideas from elsewhere, but also increasing helping to ensure effective dissemination and management of data.

Globally, the data indicates that there are on average 20 research workers for every worker in an academic or research library.

The smallest number of academic and research library workers per researcher was in Colombia, with 0.6. Eight countries in total have fewer than five researchers per academic and research library worker – as well as Colombia, Panama, Kazakhstan, Honduras, Zimbabwe, Trinidad and Tobago, Mexico and Mauritius.

Meanwhile, a number of countries had figures of more than 100 researchers per academic or research librarian, although this may be down to under-reporting of numbers of librarians.


Clearly the profile of academic libraries themselves varies strongly, depending on institutions themselves. Some will focus much more on educating undergraduates, others much more on supporting more advanced research work.

As a result, a low number of researchers per librarian can be an indicator as much of a large number of librarians (because of strong investment in research libraries) as of a small number of researchers (because a institutions has relatively little focus on research, and more on teaching in general).

A similar reflection can apply to numbers of students. A system more focused on research may therefore employ more research librarians, raising the ratio of library workers to students, but so too could a smaller number of students.

We will explore these issues further next week.


Find out more on the Library Map of the World, where you can download key library data in order to carry out your own analysis! See our other Library Stats of the Week! We are happy to share the data that supported this analysis on request.

Library Stat of the Week #27: On average, there are 4.7 volunteers for every full-time library worker

Volunteers can play an important role in helping libraries to go further in delivering on their missions. In turn, public and community libraries can be attractive places for individuals to come and offer their time.

At the same time, in some countries there is concern about over-reliance on volunteers. This can be particularly the case when staff and volunteers are seen as interchangeable by governments or other decision-makers looking to cut costs, rather than extend offers.

Both the IFLA Public and School Library Manifestos underline the importance of the presence of a librarian in order to guide services.

Clearly, understanding the respective roles of staff and volunteers depends on looking at individual libraries.

However, we can start to get an overview of the situation between countries by looking at data from the Library Map of the World.

42 countries provide information about numbers of volunteers, counted as the number of individuals who volunteer.

While these figures do not indicate how many hours they work (as opposed to data on the number of library workers, which is calculated in terms of full-time equivalents), they start to give an idea of to what extent library systems draw on volunteers to function.

Graph 1: Volunteers and Staff in Public and Community Libraries

Graph 1 looks at the situation at the global level, and broken down across different regions.

Starting with the figures for the world as a whole (the 42 countries for which data is available, accounting for 276826 libraries and 159141 FTE staff), it appears that there is 0.67 of a full-time library worker per public or community library, but 3.3 volunteers.

In other words, there are almost 5 volunteers for every full-time staff member of a public or community library.

These figures, are, however, strongly affected by the numbers from one country – the Republic of Korea, which alone registers over 433 000 volunteers.

Once these numbers are discounted, the figures are much closer together – 0.67 FTE staff per library and 1.33 volunteers, making for just over 2 volunteers for every FTE member of staff.

Looking across the regions, it is only in Europe and Asia where the number of volunteers is higher than the number of FTE staff in public and community libraries. Of course, with only 42 countries providing data (for example, figures for North America are from Canada alone), the picture is far from complete.

Graph 2: Volunteers and Staff in Public and Community Libraries (G20 Countries)
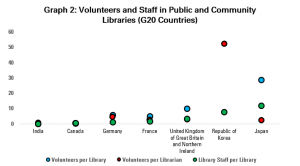
Graph 2 presents data for those larger (G20) economies for which data is available. Among these countries, it is relatively common to have more volunteers than FTE staff, with Germany, France, the UK and Japan in this situation.

Once again, Korea is an extreme case, with data indicating that there are on average 430 volunteers per library. While there are relatively high levels of staffing per library (7.9 compared to the global average of 0.67), this still means around 50 volunteers per full time staffer.

The other countries with the highest ratio of volunteers to full-time staff are Nepal (14.3:1), Austria (10.4:1), Singapore (10.4:1), Germany (4.6:1) and the United Kingdom (3:1).


Countries and territories covered by available data are: Armenia, Austria, the Bahamas, Benin, Bhutan, Bonaire, Sint Eustatius en Saba, Bosnia and Hercegovina, Cameroon, Canada, Colombia, Costa Rica, Cyprus, Czechia, Denmark, the Dominican Republic, Egypt, Estonia, Eswatini, France, Germany, Guinea, Guyana, Hungary, India, Israel, Jamaica, Japan, Lithuania, Mongolia, Nepal, Nicaragua, Paraguay, the Republic of Korea, Saint Lucia, Singapore, Slovakia, Spain, Suriname, Thailand, Uganda, and the United Kingdom.


Find out more on the Library Map of the World, where you can download key library data in order to carry out your own analysis! See our other Library Stats of the Week! We are happy to share the data that supported this analysis on request.