Tag Archives: #LibraryStatOfTheWeek

Library Stat of the Week #26: Countries with more public and community librarians tend to have higher levels of social cohesion

Eric Klinenberg’s book, Palaces for the People, has popularised the idea of libraries as key parts of the ‘social infrastructure’ of the communities they serve.

This role matters, because social infrastructure supports the development of social capital – strong connections between people, often associated with trust – commonly seen as a key driver of development.

For example, when there are strong levels of trust between people, they need to spend less time protecting their own interests, and can cooperate more easily to achieve other things, such as a strong economy, inclusive social policies, or action to tackle climate change.

Trust can be built through common references and rules, often themselves developed through contacts between people. Libraries – especially public and community libraries – support both, allowing members of communities to meet and exchange in a shared space, often supported by shared resources and heritage.

Klinenberg looks at the role of libraries in building social cohesion at the level of individual cases. But what can we tell at the macro-level?

To do this, we can cross statistics from IFLA’s Library Map of the World with those from the OECD’s Society at a Glance 2016 publication. As previously in our Library Stat of the Week series, we have looked at figures both for numbers of public and community libraries and library workers.

Graph 1: Public and Community Libraries and Library Workers and Levels of Trust
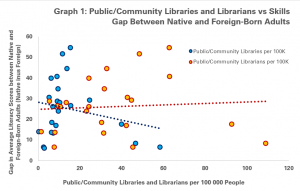
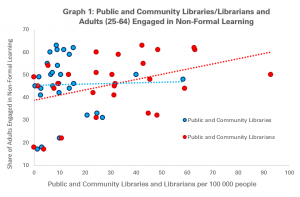
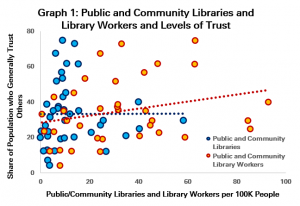
Graph 1 compares numbers of libraries and library workers (on the horizontal X-axis) with the share of the population who felt that other people could be trusted. Each dot represents one country.

This graph indicates a positive but relatively weak correlation between numbers of library workers and levels of trust, and relatively little relationship at all between numbers of libraries and trust.

There is a positive story in here, as regards library workers of course. As we have indicated in previous posts, it is clear that the presence of librarians can play a decisive role in ensuring that libraries achieve their outcomes.

However, as concerns the number of libraries, the figure is perhaps a little disappointing. Nonetheless, from looking at the graph, it stands out that the relationship may vary as the number of libraries per 100 000 people grows.

Graph 2: Public and Community Libraries and Levels of Trust
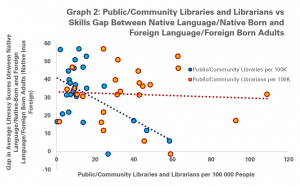
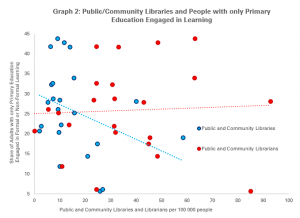
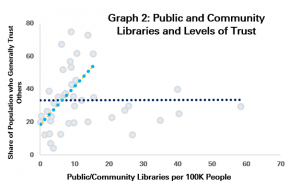
Graph 2 looks further into this question, including a trend line only for countries with fewer than 20 libraries per 100 000 people (i.e. one library per 5000 people).

The difference here is striking. There is a much stronger positive correlation between numbers of libraries and trust in countries with up to 20 libraries per 100 000 people (the light blue line), but after this, the relationship becomes much flatter.

Graph 3: Public and Community Library Workers and Levels of Trust
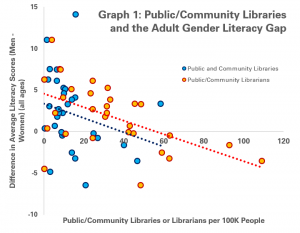
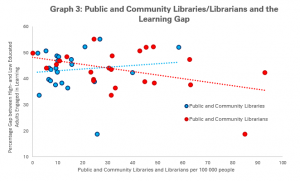
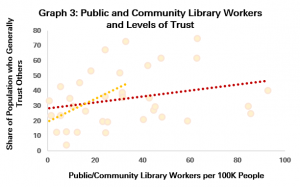
Graph 3 repeats the same process for countries with up to 40 public and community library workers per 100 000 people (the yellow line), coming to a similar conclusion. The relationship between library workers and trust is much stronger among countries below the threshold of 40 workers per 100K.

This finding is an interesting one, and would support the conclusion that in particular in countries which invest less in libraries (as measured by the number of public and community libraries and library workers), there are significant gains to be had from strengthening the field (or costs from making cuts).

Beyond a certain threshold, the gains (or costs) in terms of social cohesion are less dramatic, although as seen in previous posts, there may be impacts in other fields, such as skills or equality.

As always in this series, it is important to note that correlation is not causality. Further research would be needed to assess to what extent other factors may be in play, and it is of course also possible that societies that invest more in libraries tend to be those who believe more in supporting communal services and activities.

Nonetheless, the data here does provide a useful indicator that countries with more public and community libraries and library workers, there tends to be higher levels of social cohesion.


Find out more on the Library Map of the World, where you can download key library data in order to carry out your own analysis! See our other Library Stats of the Week! We are happy to share the data that supported this analysis on request.

Library Stat of the Week #25: At Similar Levels of GDP, Countries with More Academic Librarians See Higher Numbers of Publications

In the past two weeks, we have explored the figures that IFLA’s Library Map of the World offers us on the subject of academic libraries and library workers. We have looked at how many there are in different parts of the world, including relative to population, and last week, as correlations between numbers of libraries and librarians, and scientific publications and patents.

In the third and final post of this mini series, we take the analysis of the last point a little further, in order to see whether the positive correlation seen in particular between numbers of academic library workers per head and publishing survives when another key factor is taken into account – the overall strength of an economy.

There is a strong reason for doing this. Graph 1 compares numbers of scientific and technical publications per 100 000 people (based on World Bank data) with calculations of Gross Domestic Product per person (adjusted for purchasing power) (also based on World Bank data).

Graph 1: GDP per capita (PPPs) and Publications per 100K People

There is a very strong correlation here. This is perhaps not surprising, given that richer economies are better able to allocate resources to support higher education and research, and of course also offer a larger market.

Nonetheless, the correlation isn’t perfect, suggesting that other factors may affect numbers of publications, other than GDP.

Interestingly, in addition, the correlation between GDP per capita and publications per 100 000 people is much stronger than that between total government spending on research and development and publications.

Secondly, we can look at the relationship between numbers of academic library workers and levels of GDP. Graph 2 does this, showing, again, a positive correlation, but this time a less strong one.

Graph 2: Academic Librarians per 100 K People and GDP Per Capita (PPPs)In other words, while in general, richer countries tend to have more academic library workers, this is not always the case. Some very rich countries have relatively few, while some poorer countries have relatively many.

This opens up the question of whether there may be any positive connection between numbers of academic library workers and publications, even when we hold GDP constant. We do this, in Graph 3, by calculating how many more or fewer publications a country is producing in relation to the overall trend, and comparing this with figures for academic library workers.

Graph 2: At Constant GDP. Do More Librarians Mean More Publications?In this graph, a negative figure on the vertical axis indicates that they are producing relatively few publications for their level of GDP per person, while a positive one indicates higher publishing rates.

As we can see, there is a gentle positive correlation here. While it is not a dramatic one, this does provide a suggestion that investing more in libraries (as a key part of the research and education infrastructure) may help drive numbers of publications.

Finally, we can go a step further and look not only at relative numbers of publications compared to what would be expected at a given level of GDP per capita, but also at which countries have a relatively high number of academic librarians given their GDP per capita.

Graph 4: Numbers of Academic Library Workers and Publications, Relative to GDP Per Capita Expectations

Graph 4 does this, taking the numbers already used for the vertical axis in Graph 3, and making new calculations, based on the average trend found in Graph 2, in order to work out whether countries have more or fewer academic library workers than expected at their level of GDP per capita.

This exercise reinforces the conclusion in Graph 3, suggesting that in two countries with the same level of GDP per capita, the one which has more academic librarians will tend to out-perform one with fewer, in terms of number of scientific publications.

Clearly, this is a point that would need further analysis in order to come to any firm conclusions of course, including study at a more detailed level, in order to see to what extent correlation could mean causality. Nonetheless, it is a welcome piece of evidence for use in advocacy.


Find out more on the Library Map of the World, where you can download key library data in order to carry out your own analysis! See our other Library Stats of the Week! We are happy to share the data that supported this analysis on request.

Library Stat of the Week #24: Where there are more academic librarians, there is more publishing and patenting

As highlighted in last week’s post, academic libraries are central to any country’s infrastructure for learning and innovation. Through giving learners and researchers access to existing knowledge, and support to make the most of it, they enable work to happen that leads to social and economic progress.

Last week’s post offered an initial overview of data about academic libraries and library workers in IFLA’s Library Map of the World database, suggesting that there are, on average, 1.32 academic libraries and 10.63 academic library workers per 100 000 people.

Within this, there is strong variation across countries, with, for example, there being 26.25 academic library workers per 100 000 people in the United States, but fewer than 0.1 elsewhere.

What might this mean for the ability of countries to innovate?

In this week’s Library Stat of the Week, we’ll take a first look at data on some common metrics of innovation performance – numbers of scientific publications, and numbers of patents – in order to look for potential correlations.

For this, we can cross data from the Library Map of the World (using figures for numbers of librarians and libraries per 100 000 people), and World Bank data on scientific and technical journal articles, and on patent applications by residents, also translated into figures for numbers per 100 people.

Graph 1: Academic Libraries and Publications

Graphs 1 and 2 do this in the case of publications. The link between the strength of the academic library network and the number of scientific and technical publication is relatively clear, and makes sense intuitively.

Researchers with better access to books, journals and other resources, through libraries, are better placed to write high-quality articles themselves, likely to be accepted in good quality journals.

Graph 2: Academic Library Workers and Publications
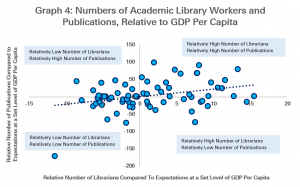
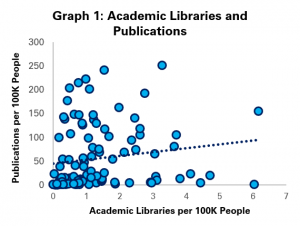
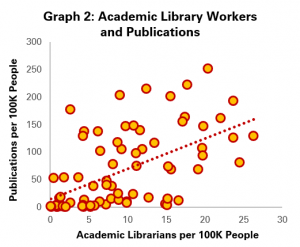
Interestingly, the correlation is stronger in the case of academic library workers (Graph 2) than in that of academic libraries (Graph 1).

It is likely that numbers of library workers is a better indicator of the strength of the field, both given the importance of staff in helping researchers, but also potential variation from country to country in how academic libraries are organised and counted.

While, as always, correlation does not mean causality (a point we will return to below), the graph does at least seem to back up the argument that a stronger library field will tend to support a higher publications output.

The next stage is to look at patents. These are often treated as a key indicator of the innovation performance of countries, given that they can be associated with new products, services and so business.

Graph 3 Academic Libraries and Patent Applications
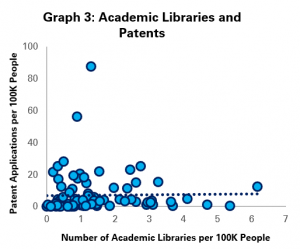
Graphs 3 and 4 therefore repeat the exercise with patent application data, comparing numbers of academic libraries and library workers per 100 000 people.

In this, in order to avoid distortion, some countries with outlying data (notably the extremely high patenting figures for China and South Korea) have been excluded in order to allow for a better look at others.

It is clear that the relationships are less clear with patents than they are with publications. This is perhaps understandable – much patenting activity comes from businesses, while publications tend to come from universities and research centres

It is already clear that correlations are weaker here – indeed, there seems to be little correlation at all between the number of academic libraries and patents at all (Graph 3).

Graph 4: Academic Library Workers and Patent Applications
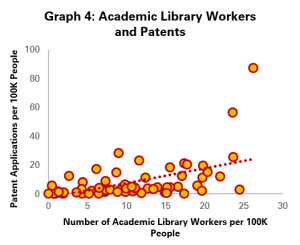
Nonetheless, on the stronger indicator of the strength of academic library fields – the number of academic library workers per 100 000 people (Graph 4) – the correlation does reappear, although is still slightly weaker than with publications.


Overall, these results do support the conclusion that countries which perform better on traditional metrics of innovativeness are also the ones that have a stronger academic library field.

As mentioned above, this is not necessarily the same as causality. In next week’s Library Stat of the Week, we will therefore try to control for some of the other potential factors which might influence this connection.


Find out more on the Library Map of the World, where you can download key library data in order to carry out your own analysis! See our other Library Stats of the Week! We are happy to share the data that supported this analysis on request.

Library Stat of the Week #23: On average, there are 1.32 academic libraries, and 10.63 academic library workers per 100 000 people globally

After a few weeks of focusing on public and community libraries, it’s time to take a look, instead, at academic libraries. These are at the heart of the institutions they serve, as well as core parts of the infrastructure of any country for learning and research.

While future posts will look at the relationship between academic libraries and library workers and various indicators of research and education outputs, this week we’ll be looking just at how many institutions and staff there are, both in absolute terms, and related to population (using World Bank data for 2018).

Overall, globally, IFLA’s Library Map of the World counts over 80 000 academic libraries globally, on the basis of data from 105 countries, representing a total population of over 6bn (almost 80% of the total).

The largest number of academic libraries is in India, with over 42 000 alone recorded there, followed by the United States (4266) and China (almost 3000). In other world regions, Nigeria has the most in Africa (815), Ukraine in Eurasia (1843), Italy in Europe (1581), Brazil in Latin America and the Caribbean (2407), Egypt the most in the Middle East and North Africa (464), and Australia the most in Oceania (190).

Numbers of Academic Libraries by region, both in absolute terms, and relative to population (per 100 000 people)

Graph 1 provides further insights into number of academic libraries per region (where India ensures that Asia comes out as having the highest number of academic libraries, but also offers figures relative to population sizes.

This helps us see that globally, there are 1.32 academic libraries per 100 000 people, although at a regional level, this varies from over 1.5 in North America to 0.31 in Africa and 0.41 in the Middle East and North Africa.

The variation is wider still at the national level, going from 6.17 academic libraries per 100 000 people in Slovenia, followed by Kiribati (6.04), Macao, China (5.38) and Argentina (4.71) to 0.004 in Madagascar. It is of course possible that there is under-reporting here.

Other regional leaders include Benin in Africa (1.87 academic libraries per 100 000 people), Ukraine in Eurasia (4.13), Bahrain in MENA (1.02), and Canada in North America (1.98).


However, as has also been underlined in the case of public libraries, staff are essential. Without them, students and researchers cannot benefit from the expertise and advice that trained librarians can bring, and the library cannot fulfil its potential.

Globally, the Library Map of the World suggests that there are almost 350 000 academic library workers, although in this case only from 78 countries’ data (accounting for 43% of the world population).

Numbers of Academic Library Workers by region, both in absolute terms, and relative to population (per 100 000 people)
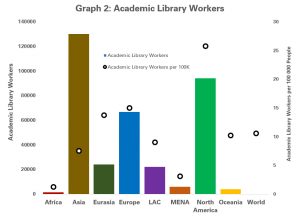
Graph 2 goes into more depth, breaking down numbers of academic library workers per region, and relative to overall population sizes. Once again, Asia comes out on top in terms of numbers of workers at almost 130 000 (not including India this time), with North America a little way behind on 93909.

At the national level, China has the largest single number of academic librarians (111023), followed by the United States (85752). Regional leaders (for which data is available) are Zimbabwe for Africa (750), Kazakhstan for Eurasia (10000), Germany for Europe (19614), Mexico for Latin America and the Caribbean (11209), Egypt for MENA (4309) and Australia for Oceania (3116).

Once again, it is interesting to look at numbers of library workers in relation to the population as a whole. Globally, there appear to be 10.63 academic library workers per 100 000 people (where data is available), with North America coming top at 25.8, and Europe some way behind at 15.02. Africa stands at 1.26 and MENA at 3.13.

At the national level, variation is wider still, going from 54.72 academic library workers per 100 000 in Kazakhstan and 26.25 in the United States to 0.07 in Uganda and 0.17 in Papua New Guinea. It is again possible that there is under-reporting here.

Other regional leaders in terms of numbers of academic library workers per 100 000 people are Mauritius in Africa (9.88), Brunei in Asia (19.12), Lithuania in Europe (24.52), Colombia in Latin America and the Caribbean (15.23), Egypt in MENA (4.38) and New Zealand in Oceania (17.43).


These figures both provide an interesting insight into the state of academic libraries around the world, but also provide a starting point for further analysis of how the strength of the academic library field might relate to other outcomes.

Clearly, we are still working with incomplete figures and so numbers need to be used with some caution, but it is already powerful to be able to start to explore these themes.


Find out more on the Library Map of the World, where you can download key library data in order to carry out your own analysis! See our other Library Stats of the Week! We are happy to share the data that supported this analysis on request.


Library Stat of the Week #22: Where there are more public and community libraries, foreign-born, foreign-language migrants experience a smaller literacy gap compared to native-born, native-language peers

In our Library Stat of the Week mini-series on libraries and equality, we have looked so far at economic inequality, educational equality, and gender equality.

Through different blogs, we’ve explored the interaction between these and numbers of public and community libraries and librarians.

One factor which all too often correlates with poorer outcomes is immigrant status. In addition to difficulty in getting used to a new culture and language, or trying to get qualifications recognised, they can also face discrimination in different dimensions of life.

There are various ways in which libraries can help, from helping newcomers to feel at home and promoting tolerance and inclusion more broadly in society. A crucial way they can make a difference is by supporting literacy by helping newcomers.

To do this, we can use data from the OECD’s Programme for the International Assessment of Adult Competences (PIAAC), which assesses literacy, numeracy and problem-solving capabilities. In carrying this out, the OECD also collected data about whether respondents were native- or foreign-born, and whether they spoke the primary native or another language as a mother tongue.

We crossed this data with numbers of public and community libraries and librarians (and related staff) from IFLA’s Library Map of the World.

Public/Community Libraries and Library Workers vs the gap in average literacy scores between native-born and foreign-born adults

In a first step, we looked at the ‘gap’ between average literacy scores between native- and foreign-born adults, as shown in Graph 1.

Each dot represents a country for which data is available, with higher scores on the vertical (Y) axis indicating a wider gap (and so worse outcomes for foreign-born adults compared to native-born ones. Figures for the gap are adjusted to control for age, gender and educational level.

The results are relatively inconclusive, with little correlation between numbers of public and community libraries and library workers, and the gap.

However, this is to forget that in many cases, a large share of immigrants come from countries where the native language is the same, or at least where the language of the welcoming country is common.

Public/Community Libraries and Library Workers vs the gap in average literacy scores between native-born/native-language and foreign-born/foreign-language adults

In Graph 2, we can address this by looking at the gap between native-born, native-language adults, and foreign-born, foreign-language adults. The difference is significant, with a much stronger correlation between greater numbers of public and community libraries and smaller gaps.


Indeed, for every 10 extra libraries per 100 000 people, the gap in literacy falls by 5.82 points on the PIAAC scale. There is a less obvious correlation with the number of librarians.


As is always noted in this series, there is a difference between correlation and causality, and this analysis does not make it possible to assess what other factors may be at play. As ever, more libraries (and librarians) may be a symptom of a society that has invested more in general in integration and inclusion.


It is nonetheless the case that where there are more public and community libraries, foreign-born, foreign-language migrants tend to face less of a disadvantage in literacy levels compared to native-born, native-language adults.


This could be explained by the possibility that libraries offer to develop language skills, either simply through access to books, or through programming (although the fact of no correlation with the number of librarians may weaken this point).


The fact of much weaker correlation in Graph 1 does at least underline that the potential of libraries as drivers of inclusion in general, beyond language, is not being realised. This is certainly an area where more can be done.


Find out more on the Library Map of the World, where you can download key library data in order to carry out your own analysis! See our other Library Stats of the Week! We are happy to share the data that supported this analysis on request.

Library Stat of the Week #21: Where there are more public and community librarians, the gender skills gap among adults is lower

Two weeks ago, we looked at data on adult literacy levels from the Organisation for Economic Co-operation and Development’s Programme for the International Assessment of Adult Competences (PIAAC), in order to explore the potential relationship with the coverage of public and community libraries in countries.

In that post, we explored the numbers of adults scoring at or below a basic level of skills, as well as the gap between the most and least literate in a population.

However, PIAAC, data also allows us to break things down further, including by gender. This has been a particularly interesting area of study, given that while girls tend to score better on literacy at school (as demonstrated by the results of the OECD’s Programme for International Student Assessment (PISA)), they too often face disadvantage on the job market.

One argument noted by the OECD itself is that the jobs that women tend to be encouraged to take up make fewer demands of their skills, and so there is less opportunity to develop these. This is clearly not an ideal situation, given the implication both that women have fewer chances to learn throughout life, but also the loss this represents to societies and economies as a whole.

As has been highlighted in each Library Stat of the Week post focused on skills issues, public and community libraries do have an important role both in helping to maintain literacy skills (through access to materials and activities), but also in providing a second chance for those who have done less well in school.

This week’s post therefore looks to compare OECD data about adult gender literacy gaps (calculated by subtracting the mean literacy score of women from that of men – a negative result means that the average women has higher skills than the average man) and numbers of public and community libraries and librarians per 100 000 people from the IFLA Library Map of the World.

It is worth noting that the data here comes primarily from OECD Member States, with each of the dots in the graphs below representing a country.

Graph 1 - Public/Community Libraries and Librarians and the Adult Gender Literacy Gap

In Graph 1, we look at data for adults of all ages surveyed (15-65). When looking both at numbers of public and community libraries and librarians, there is correlation, with more libraries/librarians tending to mean that women on average have higher literacy skills than men.

The correlation is stronger when looking at librarians as opposed to libraries – an observation that has also appeared in previous blogs.

As ever, correlation does not always mean causality. In particular, the size of gender gaps above may be influenced by investment in high-quality and inclusive schools (something which is also likely to correlate with investment in libraries).

A next step then is to look at differences over time, given that the advantage that may come from high-quality education will diminish over time, and other factors – such as the presence of public and community libraries – will count for more.

Graph 1 - Public/Community Libraries and Librarians and Evolutions over time in the Adult Gender Literacy Gap

Graph 2 does this by looking at the evolution of the adult gender literacy gap between 15-24 year olds and 45-65 year olds.

On the vertical axis, a score above zero indicates that the gap between men and women is more favourable to women among 45-65 year olds than among 15-24 year olds, whereas a score below zero implies a wider gap among older than among younger adults.

The graph suggests that there is a positive correlation between numbers of public and community library workers per 100 000 people and stability or improvement in the adult gender literacy gap over time.

Clearly, as ever, there can be other explanations – countries which have seen improvements in the gender gap (in favour of women) may also have a range of policies in place that support life-long learning, and a more equitable employment situation for women.

Nonetheless, the correlation is a welcome support for efforts to ensure that libraries are a part of any government strategy to promote gender equality.


Find out more on the Library Map of the World, where you can download key library data in order to carry out your own analysis! See our other Library Stats of the Week! We are happy to share the data that supported this analysis on request.

Library Stat of the Week #20: Countries with more public librarians have more adults engaged in non-formal education… but there is more to do!

In last week’s Library Stat of the Week (#19), we looked at the connection between literacy skills among adults and numbers of public and community libraries and librarians, finding a correlation between numbers of librarians per 100 000 people and numbers of adults with low skills. In general, more librarians tend to mean fewer adults with low skills.

The reason for looking at these numbers is the fact that public libraries in particular traditionally have a role in facilitating literacy and learning in their communities.

This often happens in a very informal way, for example simply through independent reading or other use of library resources. However, libraries also have a role as a venue for – or portal to – more formal opportunities.

As underlined in the chapter of the 2019 Development and Access to Information report on SDG4, libraries can indeed be a vital part of countries’ infrastructure for lifelong learning.

So this week, we’ll look at the relationship between numbers of public and community libraries and the numbers of adults (aged 25-64) currently engaged in learning. Once again, we’ll use data from the Organisation for Economic Cooperation and Development (OECD) Programme for the International Assessment of Adult Competences (PIAAC). Library data comes from IFLA’s Library Map of the World.

Graph 1: Public and Community Libraries/Librarians and Adults Engaged in Non-Formal Learning

The first graph looks at the relationship between the number of public and community libraries and librarians per 100 000 people and the share of the adult population in non-formal education (source). Each dot represents a country for which data is available for adult learning, and for numbers either of public and community libraries and librarians.

In a similar result to that found in last week’s Library Stat of the Week, there is correlation in the case of public and community librarians, with more librarians tending to mean more people engaged in non-formal learning. The link is less strong in the case of public and community libraries.

As with last week, this could be explained by the fact that it is the presence and support of library and information workers that helps people to make connections with learning opportunities.

The next question is to see whether there is any sign of a connection between numbers of public and community libraries and librarians, and the number of people with lower levels of education (who have not completed secondary education) involved in adult education.

Graph 1: Public and Community Libraries/Librarians and Adults with only Primary EducationEngaged in Learning

Graph 2 does this, using figures for adults involved in all sorts of learning (formal, non-formal and a combination of the two) (source). This provides a less positive picture, with no obvious relationship between access to learning and numbers of librarians, and even a negative one with numbers of public libraries.

This suggests that governments are not yet making full use of libraries in order to help those who have not had the opportunity to reach the end of secondary education to access education. Given the evidence of what libraries can do, this is a chance missed.

Nonetheless, it is also worth bearing in mind that some countries have lower levels of adult education in learning than others in general, which helps put the number of those with only primary education in context. Other drivers of access to lifelong learning can of course be factors such as how this is paid for, or the volume and attractiveness of the offer.

We can get an alternative perspective here by looking at the ‘learning gap’ – the difference between the share of adults with university and only primary education who are currently engaged in non-formal and/or formal education (source).

Graph 1: Public and Community Libraries/Librarians and the Learning Gap among Adult Learners with only Primary, and University Education

This in interesting as an indicator of equality, as a smaller gap means that there is a lower risk of people starting with less education falling further behind. Graph 3 shows what happens when we compare the size of this gap with numbers of public and community libraries and librarians.

Encouragingly, we see a return to the sorts of figures seen in Graph 1 and last week’s Library Stat of the Week, with larger numbers of public and community librarians per 100 000 people correlating with smaller gaps in access to learning.

While, as ever, correlation does not mean causality, one explanation here would be the role that libraries can play in ensuring that adults can have a second chance. While those who have been to university may feel more confident in looking for opportunities for opportunities for further learning, or be in jobs that welcome and support this, this may be less likely for those with only primary education. Libraries can help fill the gap.

With many – especially those in lower-skilled, lower-paid jobs – facing unemployment in the wake of the COVID-19 pandemic, governments would do well to invest both in skills provision, and the libraries that help those who need it most to find it.


Find out more on the Library Map of the World, where you can download key library data in order to carry out your own analysis! See our other Library Stats of the Week! We are happy to share the data that supported this analysis on request.