Tag Archives: school libraries

World Education Support Day: an opportunity for school librarians

Four years ago, Education International, the world’s leading international education trade union organisation, launched its Declaration on Education Support Personnel (ESP), defined as covering a wide range of professional, administrative, technical, and general staff working within the education sector such as teaching assistants, school nurses and psychologists, bursars, bus drivers, and, of course librarians. 

The day of the signing of the Declaration, 16 May, was set by the organisation as World Education Support Personnel Day, and since then, each 16 May has brought events and publications highlighting the specific needs of ESP.

With many ESP being members of wider education unions, this was a logical step, but also a reminder of the need to remember that effective education and teaching depends on a wide range of people.

IFLA and libraries have of course long underlined how essential library services are for education throughout life, with both the Public Library Manifesto and School Library Manifesto stressing our institutions’ and profession’s ability to contribute to learning.

Yet is is also true that school libraries in particular face real challenges in the face of cuts to education spending (see stories from the US about ‘disappearing’ school librarians), while university librarians can face challenges in asserting their status vis-à-vis other departments (see, most recently, stories from Texas A&M).

There is a pressing need to ensure that libraries are seen as having a central – rather than a peripheral or optional – role in education. We need it to be clear that libraries are not disposable – a nice-to-have rather than a need-to-have – and indeed are key to delivering the new vision of education set out in UNESCO’s Futures of Education report.

As part of these efforts, Education International’s Declaration on ESP is a powerful support for advocacy. This blog sets out three key arguments which libraries and library associations can then draw on in advocacy:

Librarians and other ESP are central to education:  As already indicated above, the Declaration offers strong support for a vision of schools and wider learning environments that recognises how essential ESP are. They help ensure that learning environments are positive and safe, delivering on the right to education, and indeed contribute significantly to building the ‘whole student’, with the full range of skills needed to succeed.

Crucially, this means, as article 5 indicates, that ‘ESP are a part of a team of education employees that contribute to student learning. They deserve to be valued and respected for their contribution to quality education’. Importantly, and reflecting a wider Education International priority, the Declaration also comes out strongly against out-sourcing.

Librarians and other ESP must be given equal treatment and be involved in decision-making: the follow on from this point is that given their role in supporting learning, ESP should be fully engaged in the way in which schools and other institutions are run. Logically, this includes the way in which knowledge and skills are shared and developed.

Furthermore, the landing page for Education International’s work in this area underlines that for similar levels of qualification and experience, librarians and other ESP should enjoy the same rights and status as formal teaching personnel. This would certainly be welcome, underlining that librarians and others must not be treated as second-class.

Librarians and other ESP deserve decent working conditions: again following on from the above, the Declaration underlines that there is specific need to work to give ESP – and so librarians – quality employment. This is not just about salaries, but also about employment perspectives, and a freedom from threats of harassment or other insecurity.

This is indeed the focus of this year’s World Education Support Personnel Day, which stresses deteriorating conditions for many in the field, and indeed loss of status or job security.


The Declaration is therefore a useful reference for libraries and library associations around the world working to protect the status of librarians based within education institutions, both in mobilising the support of wider education unions, and in engaging directly with governments.

Take a look at the Education International website for additional insights, information and research that can help you in your advocacy.

Library Stat of the Week #40: School children without a room of their own or an internet connection rely more on libraries than their peers

Last week’s Library Stat of the Week started to explore the data available from the Organisation for Economic Cooperation and Development’s Programme for International Student Assessment (OECD PISA) regarding libraries and inequalities.

Based on a series of questions about the type of use that students (15 year olds taking part in the test) make of libraries, and how often, the PISA 2009 database provides an index of use of libraries.

By looking how different groups, on average, score on this index (running from -1 (no use) to +1 (extreme use)), it is possible to get a sense of whether there is relatively more or less dependence on libraries, according to different characteristics. As such, this provides valuable insights into how the benefits (or pain) of investment in (or cuts to) libraries may fall.

Following on from looking at differences in library usage between 15-year olds who have a 1st or 2nd generation immigrant background, as opposed to ‘native’ students, this week looks at two indicators of disadvantage – whether children have a room of their own at home or not, and whether they have household internet access or not.

Both of these are not only signs that a student may come from a less well-off background, but can also have a direct effect on their ability to benefit from education. The possibility to read and study quietly, and to make use of all that is available on the internet, are powerful.

We start by looking at differences between students who do, and do not, have a room of their own.

Graph 1a: Difference in Library Use between Students Without, and With a Room of their Own

Graph 1b: Difference in Library Use between Students Without, and With a Room of their Own

Graphs 1a and 1b do this for each country for which data is available, giving a figure for the difference in the index of library use between students who do not, and do, have a room to themselves. A bar to the right shows that students who do not have such a private space make more use of libraries than students who do, while a bar to the left shows the contrary. The longer the bar, the bigger the difference.

Overall, it shows that in OECD countries, students who do not have a room for themselves score 0.15 points higher on average on the library usage index, while globally, the figure is 0.07. The biggest differences are to be seen in Scandinavian countries, as well as the Netherlands and Germany.

In 38 countries, students without a room of their own make more use of libraries than those who don’t. In 19 countries, it is the other way around, while in 3, there is no difference.

Graph 1c: Difference in Library Use and Average PISA Reading Scores

Graph 1c looks at whether there is much difference in this level of reliance on libraries depending on overall average reading scores. As in last week’s post, there appear to be two groups of countries – with richer countries which tend to score higher in blue, and developing countries tending to score lower in green.

Within each group, however, there is little correlation between the level of reliance on libraries by students without rooms of their own, and overall reading scores. In other words, it seems not to matter much whether a country is a high or low performer overall – those who are disadvantaged continue to make strong use of libraries.

Graphs 2a and 2b replicate the analysis in Graphs 1a and 1b, but rather comparing scores for library use between students who do not, and who do, have internet access at home.


Graph 2a: Difference in Library Use Scores between Students Without and With Home Internet Access

Graph 2b: Difference in Library Use Scores between Students Without and With Home Internet Access

The differences here are even stronger, with an OECD average difference of 0.23 and a global average of 0.17, illustrating that globally children without home internet access rely more heavily on libraries than those who don’t.

In 48 countries out of 59, libraries appear to be more important for children without home internet access than for those with it, while only in 11 do children with internet access at home make more use of libraries than those who don’t. Interestingly, the countries with the highest differences in usage are different to the ones which come top when looking at students with rooms of their own.

Graph cc: Difference in Library Use and Average PISA Reading Scores

Graph 2c then repeats the same logic as Graph 1c, looking at whether there is any reason to believe that the connection between lack of a home internet connection and library use is stronger or weaker depending on overall literacy scores.

The result – as in the case of Graph 1c – is that there is no clear connection, either in the group of lower performers or the group of higher performers. In other words, it does not matter much how well a country performs overall on literacy, library use tends to be higher among students without an internet connection at home.


The overall conclusion of this blog is that the evidence indicates that, in general, students who face barriers to benefitting from education due to their home environment tend to rely more on libraires. The corresponding argument is then that when library services are cut back, the pain will be higher for those who already have fewer resources or options.

Next week’s post will look at another dimension of inequality – the highest level of education achieved by parents.


Find out more on the Library Map of the World, where you can download key library data in order to carry out your own analysis! See our other Library Stats of the Week! We are happy to share the data that supported this analysis on request.

Library Stat of the Week #39: Globally, 1st and 2nd generation immigrant students make more intensive use of libraries than their native peers

One of the most worrying aspects of the COVID-19 pandemic and its consequences has been the deepening of the educational divide.

As highlighted in the Gates Foundation’s Goalkeepers report, there is a significant risk that the closure of school buildings will increase inequalities. In effect, groups that previously faced risks of worse educational outcomes face an even higher risk now.

While it is difficult to gather statistics on what is happening already, we can at least look back at available data to understand what factors might contribute to combatting this inequality. This can provide a basis for planning for the recovery afterwards.

Fortunately, the dataset from the Organisation for Economic Cooperation and Development’s Programme for International Student Assessment (OECD PISA) 2009 offers insights here.

We have already been able, in previous posts, to note the connection between access to a library and enjoyment of reading, and library availability and literacy skills.

This post looks to understand the connections between library use and just one potential vector of inequality – immigrant status.

As part of its data collection, as well as measuring levels of literacy and asking questions about library use, PISA 2009 also asked if the 15-year olds involved were first or second generation immigrants, or ‘native’ (i.e. all others). This allows us then to look at how far immigrant children, and the children of immigrants, depend on libraries.

Graph 1a: Difference in Library Usage (1st Generation Immigrants minus Native)

Graph 1a looks at the situation for 1st generation immigrants, providing for each country a figure for the difference between immigrant and ‘native’ 15 year olds in terms of scores on the index of library use compiled by the OECD. This index is made up of figures related to how often students borrow books – for work or pleasure – or use the library in other ways, and runs from -1 to 1.

In the graph, a longer bar to the right indicates that 1st generation immigrant students use the library more intensively than natives. A bar to the left indicates that they use it less.

Overall, the conclusion is clear – in all but two countries, 15-year olds with a 1st generation immigrant background make much stronger use of libraries than native peers.

Graph 1b: Difference in Library Usage (1st Generation Immigrants minus Native)

Graph 1b replicates this analysis, but comparing 2nd generation immigrant students to ‘native’ students. While the effect is less strong, only 9 of the 43 countries for which data is available see 2nd generation immigrant students use libraries less than native students.

In both graphs, the United Kingdom and Norway share the top spots in terms of how much more immigrant students use libraries than natives.

These graphs also send a clear signal – libraries tend to be better used by students who can risk otherwise being left behind. It follows that any reduction in the possibility to use libraries is more likely to hurt students from immigrant backgrounds.


Graphs 1a and 1b allow us to look at individual countries. What about overall trends, for example when we compare these figures with how students perform in general on literacy, or how much native students use libraries?

Graph 2: Difference in Levels of Library Use (1st/2nd Generation Immigrants vs Native) Compared with Overall Reading Scores

Graph 2 looks at the first of these questions, comparing the difference in library usage between 1st/2nd generation immigrant students and native peers (horizontal axis) and average scores for literacy for the whole population (vertical axis). Each dot represents a country.

Overall, there appears to be a positive correlation, with higher gaps in levels of library usage between immigrants and natives leading to higher overall reading scores.

In reality though, it perhaps makes more sense to see the countries presenting as falling into two groups – one of higher performers (usually richer countries) in the top right, and a group of less developed ones in the cluster in the middle-left.

In each of these groups, there is in fact little correlation between differences in library use and overall reading scores.

The lesson from this is then that the value of libraries to immigrant students does not depend on how well a country is performing in general – libraries seem to matter in both cases.

Graph 3: Difference in Levels of Library Use (1st/2nd Generation Immigrants vs Native) Compared with Native Library Use

Graph 3 repeats this, but this time, the vertical axis looks at levels of library use among native students. Here, there is a more obvious correlation, with differences in library usage higher in situations where native students are using them less.

To some extent, this is logical – if natives use libraries less, and immigrants use them to the same extent, of course the gap will be higher.

In policy terms, however, the implication is that even where there is less use of libraries by native students, they continue to be important to immigrant students.


As highlighted last week, there appears to be a strong link in almost all countries surveyed between library use and scores in the literacy component of PISA.

This week’s statistics indicate that, in turn, 1st and 2nd generation immigrant students tend to be more intensive library users than their native peers. This connection tends to hold, regardless of the overall level of literacy in the population, and even when native students use libraries less.

While of course correlation cannot be taken for causality, the data here supports the argument that ensuring access to libraries will be an important part of any effort to close the education divide.


Find out more on the Library Map of the World, where you can download key library data in order to carry out your own analysis! See our other Library Stats of the Week! We are happy to share the data that supported this analysis on request.

A Vital Job at a Difficult Time: Libraries Supporting Teachers During COVID-19

The closure of schools as part of the response to COVID-19 has had major consequences that have not only been felt in the short-term, but that may continue to be felt well into the future.

Teachers have been obliged to change their way of working dramatically at short notice, going from in-person teaching to online. This has forced a rapid learning process which, however successful, has still left the frustration of not being able to interact with and support students in person.

In turn, while many are still able to continue to work from home, teachers have again been among the first to return to their jobs.

Of course, librarians in all library types involved in promoting education and learning, will share these feelings. Stories of shifting activities online, adapting and innovating using digital technologies, and overcoming challenges are common to both professions.

But the shared experiences are not just limited, in abstract terms, to the type of work being done. Collaborative working is also happening in reality, on the ground, with librarians working hard to support and complement the work of teachers, even in difficult times.

To mark World Teachers Day 2020, this blog highlights just some of the examples we have seen of support being given:


From Physical to Digital Materials: clearly one key form of support provided by librarians to teachers was access to materials both to support lessons, and to encourage wider reading (itself a key driver of literacy skills).

Even with libraries physically closed, this role has continued, for example at the Marisa Escola Social Santa Monica in Brazil, where the library engaged closely with teachers in their lesson planning to identify and provide access to appropriate materials. With so many materials available on the internet, help in finding the right ones has been strongly appreciated.

Similarly, the Portuguese School Libraries Network created consultation hours where teachers could approach school librarians in order to identify available materials for lessons. Meanwhile in Massachusetts, United States, school librarians joined teacher Zoom meetings in order to understand needs, as well as proactively reaching out to set out how they could help.

Other libraries have stepped up, with the National Library of Spain for example expanding and promoting its offer of curated materials to support education.


Continued Support for Literacy: another key way in which libraries support teachers is by helping develop the wider literacy skills that ensure that students can engage more effectively with other subjects on the curriculum. School and public libraries in Malaysia, for example, have used social media and other tools to advance the country’s wider programme for reading promotion, eNILAM.

School libraries have worked to make the most both of physical and digital collections, even under pandemic conditions. For example, Roosevelt Elementary School in Lakewood, OH, United States set up a ‘book-grab’ service based on a virtual school library, looking to give children as strong a sense of continuity as possible, alongside activities such as ‘battles of the books’.

Children have also, of course, benefitted from work in public libraries to maximise access to collections, develop online storytimes, and in particular, to deliver digital library cards thanks to agreements between schools and libraries.


Wider Skills Provision: libraries have also been working hard to realise their potential in providing after-school or other extra-curricular learning opportunities that complement what children learn in school. For example, in Portugal, libraries have coordinated with schools in order to run programmes that start soon after school hours, in order to keep children engaged and learning.

Arlington libraries, VA, USA have encouraged children to create ’quaranzines’ in order to express their creativity and share their experiences, while the National Library of Jamaica has developed programming focused on helping students towards their exams.

While activities such as summer reading challenges (in the northern hemisphere) have often not been possible in person, this has not stopped libraries running programmes online, with the National Library of France running events every week in coordination with the Ministries of Culture and Education. Meanwhile, in the US, libraries are finding new ways to run maker-spaces, teach STEM skills or promote information literacy and critical thinking.


These examples of course only scratch the surface. As such, they give just a tiny view of all that libraries can do – and are doing – to help teachers during extraordinary times. Across these, the value of close cooperation between teachers and librarians appears clear, both in order to ensure that teachers understand what libraries can offer, and librarians understand what teachers need.

As the world looks to imagine a future post-COVID, we can hope that a key part of this will be enhanced cooperation with libraries. As we have seen, when cooperation succeeds, students stand to benefit, reducing the risk of long-term negative impacts from the COVID-19 pandemic.

Library Stat of the Week #37: The connection between having access to a library and enjoyment of reading is strongest among children in Austria, France and Montenegro

Last week’s Library Stat of the Week looked at the connection between numbers of school libraries and levels of enjoyment of reading, combining data from IFLA’s Library Map of the World and the OECD’s PISA study.

As highlighted, simply counting the number of students per school library has limits as an indicator of the strength of the sector, as it depends heavily on the structure of schools as a whole.

It also does not account for the number of staff. As we have seen with public libraries in various previous posts, numbers of public and community library workers tend to be more closely linked to positive outcomes, such as literacy and equality.

An alternative perspective can come from digging deeper into the OECD’s PISA data. There is in fact a wealth of information specifically about libraries, based on their 2009 survey.

This post will therefore be the first of a series looking into the lessons we can gain from this source. Picking up on last week’s theme, this week’s blog looks at the links between students’ access to libraries – and use of them – and their level of enjoyment of reading.

As highlighted last week, this matters, as enjoyment of reading in turn is associated with higher overall reading performance.

Graphs 1a and 1b look at the data on the difference in level of enjoyment of reading between students who do, and do not have access to a library.

Graph 1a: Difference in Enjoyment of Reading Between Children With and Without Library Access

Graph 1b: Difference in Enjoyment of Reading Between Children With and Without Library Access

Given the number of countries, it is divided into two graphs, with countries organised according to the gap in levels of enjoyment of reading – the first graph shows countries where the difference in levels of enjoyment is highest.

We can therefore see that this is highest in Austria, Taiwan (China), France and Montenegro. In almost all countries, those who have libraries tend to enjoy libraries more than those don’t.

There are some exceptions though. Yet simply having a library does not mean that it is used. In order to dig further, it makes sense to look at how different types of library use are linked with enjoyment of reading.

Graphs 2a and 2b therefore look at the connection between how regularly 15-year-olds borrow books for fun, and their level of enjoyment of reading.

Graph 2a: Library Borrowing for Pleasure and Level of Enjoyment of Reading


Graph 2b: Library Borrowing for Pleasure and Enjoyment of Reading
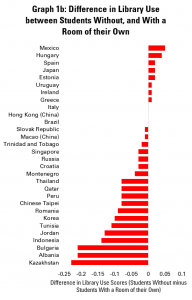
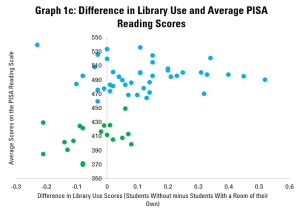
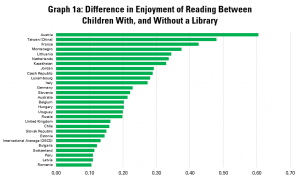
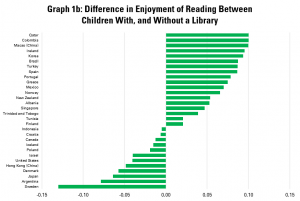
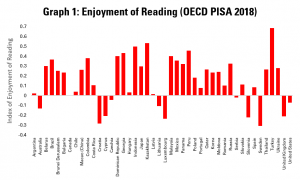
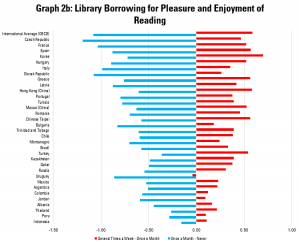
These graphs indicate levels of enjoyment of reading amongst 15-year olds who borrow books only once a month, compared to those who do so never, and those who do so several times a week.

In these graphs a longer blue line to the left indicates that there is a bigger gap in enjoyment of reading between occasional borrowers (once a month) and those who never read. A longer red line to the right indicates a bigger gap in enjoyment between very regular borrowers (several times a week) and occasional ones (once a month).

It is not a surprise of course that there is a connection between the two here – in every country, those who borrow more enjoy reading more. Interestingly, in general, the gaps are bigger between occasional library borrowers and those who never borrow, rather than between the more frequent and the occasional borrowers.

It is in Finland, Germany, Austria and Switzerland where the links between regularity of borrowing books and enjoyment of reading are strongest. The implication here is that building up a habit of library borrowing can correlate with enjoyment of reading.

Graph 3a: Library Use for Homework and Enjoyment of Reading


Graph 3b: Library Use for Homework and Enjoyment of Reading
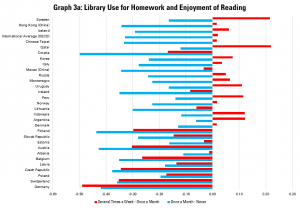
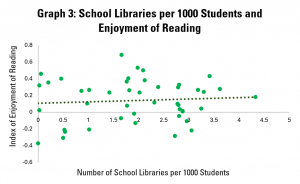
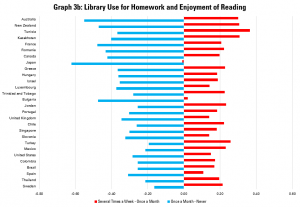
Graphs 3a and 3b look at the links between levels of enjoyment of reading and how often students use the library to carry out homework.

In these graphs a longer blue line to the left indicates that there is a bigger gap in enjoyment of reading between those who occasionally use the library to do homework (once a month) and those who never do. A longer red line to the right indicates a bigger gap in enjoyment between very regular users of the library for homework (several times a week) and occasional ones (once a month).

As can be expected, the difference between level of enjoyment of reading between those who use libraries to do homework regularly, and those who don’t, are less marked than in the previous example.

Nonetheless, the connection is positive in all but one country, suggesting that having library spaces which are suitable for children to do homework is associated with more positive attitudes toward reading. Australia and New Zealand see the most positive connections in this regard.

Graph 4a: Reading for Fun at the Library and Enjoyment of Reading


Graph 4b: Reading for Fun at the Library and Enjoyment of Reading
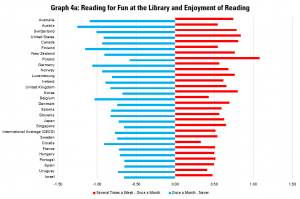
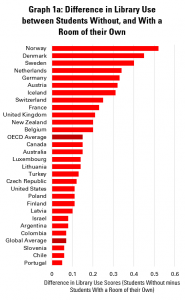
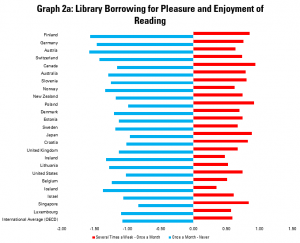
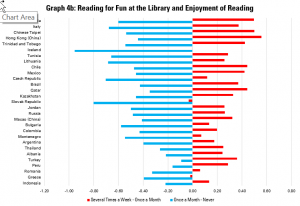
Finally, graphs 4a and 4b look at the links between enjoyment of reading and using the library to read for fun. Again, it is expected that more regular reading for fun at the library is linked to greater enjoyment of reading in general.

In these graphs a longer blue line to the left indicates that there is a bigger gap in enjoyment of reading between those who occasionally use the library to read for fun (once a month) and those who never do. A longer red line to the right indicates a bigger gap in enjoyment between very regular users of the library to read for fun (several times a week) and occasional ones (once a month).

In every country, the link is positive. As with borrowing of books, it also seems that there are bigger gaps between those who visit occasionally and those who never visit, than between the most regular users and more occasional ones.

Again, Australia, followed by Austria, Switzerland and the United States, has the most dramatic links between reading for fun at the library and enjoyment of reading overall.

This would support the argument that work to promote reading for fun in libraries can have a positive long-term pay-off.


In sum, the OECD data, even if a little old now, nonetheless provides valuable evidence of the connection between access to – and use of – libraries by school children, and enjoyment of reading.

Next week, we will look at how this translates into results in terms of literacy scores.


Find out more on the Library Map of the World, where you can download key library data in order to carry out your own analysis! See our other Library Stats of the Week! We are happy to share the data that supported this analysis on request.

Library Stat of the Week #36: Where there are more school libraries, children enjoy reading more

The Gates Foundation’s Goalkeepers 2020 report, published earlier this week, highlights the risk that literacy could suffer as a result of the COVID-19 Pandemic.

It presents different projections, suggesting that the share of children finishing primary school with the ability to read and understand a basic text could fall back to 2015, or even 2010 levels.

This has important knock-on effects, with children then struggling to engage with other subjects at school, achieving less, and finding it harder to integrate into the labour market later in life.

A key determinant of literacy, as underlined in the OECD’s Programme for International Student Assessment (PISA) is enjoyment of reading outside of school. In turn, a key argument made in library advocacy is that our institutions – both public, and embedded in schools, can help build a love of reading.

There have been a good number of studies exploring the connection between school libraries and reading performance at the local level. But what does the data say at the global level?

To explore this, we have brought together information from the IFLA Library Map of the World, as well as OECD PISA data, which used surveys of students alongside tests to find out about habits related to reading.

Graph 1, as a first step, looks at average levels of enjoyment of reading among 15 year olds in participating countries, based on data for 2018. The higher (more positive) a bar is, the more children in the country, on average, report enjoying reading.

Graph 1: Enjoyment of Reading (OECD PISA)

This underlines strong variation between countries, with 15 year olds in Turkey, Kazakhstan, Peru and Indonesia displaying the highest level of enjoyment of reading, while those in Denmark, Croatia and Sweden were less keen.

It is worth noting that total figures, as displayed here, cover varying levels of enjoyment within populations (and indeed, it is on this basis that the OECD can show links between enjoyment and literacy).

Graph 2 turns to the number of school libraries per student. Combining UNESCO Institute for Statistics data with that from the IFLA Library Map of the World data, we can work out how many school libraries there are for every 1000 children enrolled in primary or secondary schools.

Graph 2: School Libraries per 1000 students

For countries for which we have data, there are an average of 1.81 school libraries per 1000 students. Within this, there is strong variation, with the largest number of school libraries per student being found in Poland, Georgia, Moldova and Ukraine.

Graph 3 brings this data together, with numbers of school libraries per 1000 students on the horizontal (X) axis, and the enjoyment of reading index on the vertical (y) axis.

Graph 3: School Libraries per 1000 Students and Enjoyment of Reading

This indicates a positive correlation between numbers of school libraries and enjoyment of reading, demonstrated by the gently rising line. This indicates that in general, where there are more school libraries, enjoyment of reading.

Clearly, however, there are limitations to this finding. First of all, not all countries operate with school libraries, with public libraries taking up their role. And of course, having more school libraries may be part of a wider strategy to promote reading, including through different techniques for promoting this.

They may also organise schools differently, with larger or smaller institutions, which will affect the number of libraries per student. Finally, data on school library workers is limited, meaning that is it not possible to carry out analysis using this.

Future editions of Library Stat of the Week will dig deeper into the available data on school (and public) libraries, and results from OECD’s work on reading habits and performance among children.


Find out more on the Library Map of the World, where you can download key library data in order to carry out your own analysis! See our other Library Stats of the Week! We are happy to share the data that supported this analysis on request.

Engage through the Page: Libraries and Books Help Young People become Full Citizens

The climate marches that have marked the news in so many parts of the world over the last few months are, to a large extent, thanks to the mobilisation of young people.

The logic behind this is simple – this is the generation that will face the consequences of inaction today. But is it also reassuring to see a response to the cliché of younger people being disaffected or uninterested in global issues.

This is because democracy depends on people not only having opinions, but being ready to stand up and debate these in public. And as the climate marches have shown, the process of becoming a confident, informed, engaged citizen can start young.

This blog – on the first day of International School Library Month – looks at how libraries contribute to this.


Wider Horizons – School Libraries and Citizenship

School libraries – or other libraries providing school library services in some countries – have a mission not only to support teachers by helping develop literacy and a love of reading, but also to go further.

As set out in the IFLA-UNESCO School Libraries Manifesto, which turns 20 this year, they should also be gateways to the wider world, helping young people discover and engage with diverse ideas, experiences and opinions.

Just as any other library, in effect, school libraries provide a platform for young people to access information about the world, to build their awareness and sensitivity, and to exercise their intellectual freedom as an essential foundation of effective and responsible citizenship and participation in a democracy.

There are many great examples of this at work, for example in Portugal, where the Rights for Right project looks to make the link between literacy and citizenship, with an early focus on human rights. In the United States, school librarians work to build awareness of ethical issues among students, while in Brazil, libraries have stepped in where schools have been unable to help young people come to terms with the economic and social issues they face.


Starting the Conversation – the SDG Book Club

Of course, it isn’t necessarily easy to know where to start in order to get a discussion going about issues outside of the curriculum. Books can offer a way in – and indeed they do in all of the examples mentioned above. By telling a story, they can provide a less direct way of getting young people thinking, especially when they look to make the links between what they are reading, and their own experience.

The Sustainable Development Goal (SDG) Book Club is one way of finding books that allow this to happen.

Set up by the United Nations in cooperation with IFLA, the International Publishers Association, the International Board on Books for Youth and the European and International Booksellers’ Federation, this provides a sample of books in each of the six official languages of the United Nations for each of the SDGs, month by month. The most recent list focuses on SDG 5 (gender equality), with SDG 6 (water and sanitation) up next.

The website, in addition to ideas for books, also has a number of other tools, for example how to set up a local book club, communications materials, a newsletter, and a blog – take a look!


With the need for – and potential of – engagement by young people shown by the recent climate marches, there is a window for school libraries to show what they are doing to create the citizens of the future. International School Library Month provides a great opportunity, and the SDG Book Club a great tool, to do this.


Find out more about the work of IFLA’s School Libraries Section.