In the last two Library Stat of the Week posts (#16 and #17), we’ve looked at the relationship between the numbers of public and community libraries and librarians per 100 000 people, and a key indicator of inequality, the Gini Coefficient.
Drawing on data from the Library Map of the World and the World Bank, it has been possible to show that there is an association between these. Both having more libraries, and more librarians tends to be linked to lower levels of inequality.
Indeed, as highlighted last week, even when controlling for the number of libraries in a country, having more librarians per library is also correlated with higher levels of equality.
A next step is to look at equality over time, or social mobility. The Organisation for Economic Cooperation and Development does this by looking at the level of change – or ‘elasticity’ of wages between fathers and sons.
This makes it possible to show how far someone from a poor background has a chance of finding a well-paid job or other opportunity, or whether poverty is likely to continue across generations.
This is an important indicator, not least for social cohesion and wellbeing, given that people are likely to be more optimistic about the future when the chances of improving their lives, and those of their children, are higher.
As set out in the previous blogs, libraries – and in particular public and community libraries – have a core mission to promote equity. Indeed, at the heart of the Public Library Manifesto is the idea that everyone should have access to education in order to improve their situation.
As a result, arguably, public libraries are social mobility institutions, giving everyone the chance to build better lives.
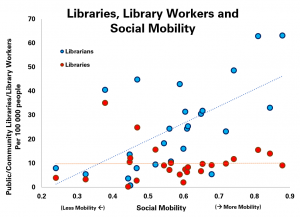
To test the connection, we can therefore compare the data already used from the Library Map of the World for the numbers of public and community libraries and librarians (numbers per 100 000 people), and the OECD’s data on social mobility (primarily available for its members – developed countries, and measured from 0-1 with 1 being the highest level of mobility), as in the below graph., with each dot representing a country for which data is available.

This tells two contrasting tales, with seemingly relatively little link between the number of libraries per 100 000 and social mobility, but a relatively strong one between the number of librarians and mobility.
Indeed, of the top four countries for social mobility, three are also the top-performers for numbers of librarians per 100 000 people (Denmark, Finland and Norway). The only high performer on social mobility with a low number of librarians was Canada, while Hungary and France stand out for having a relatively high number of librarians, but still have lower social mobility.
As ever, correlation does not mean causality. It is true that investment in librarians is likely to be a sign of a society that cares about giving everyone an opportunity to do better. Similarly, librarianship can also be the sort of profession that allows people to be socially mobile.
It does remain a powerful message, however, that socially mobile societies tend to be those with more public and community librarians. As governments look to build more inclusive, equitable societies post-COVID-19, this is a valuable point to make.
Find out more on the Library Map of the World, where you can download key library data in order to carry out your own analysis! See our other Library Stats of the Week! We are happy to share the data that supported this analysis on request.