Tag Archives: Literacy

A Vital Job at a Difficult Time: Libraries Supporting Teachers During COVID-19

The closure of schools as part of the response to COVID-19 has had major consequences that have not only been felt in the short-term, but that may continue to be felt well into the future.

Teachers have been obliged to change their way of working dramatically at short notice, going from in-person teaching to online. This has forced a rapid learning process which, however successful, has still left the frustration of not being able to interact with and support students in person.

In turn, while many are still able to continue to work from home, teachers have again been among the first to return to their jobs.

Of course, librarians in all library types involved in promoting education and learning, will share these feelings. Stories of shifting activities online, adapting and innovating using digital technologies, and overcoming challenges are common to both professions.

But the shared experiences are not just limited, in abstract terms, to the type of work being done. Collaborative working is also happening in reality, on the ground, with librarians working hard to support and complement the work of teachers, even in difficult times.

To mark World Teachers Day 2020, this blog highlights just some of the examples we have seen of support being given:


From Physical to Digital Materials: clearly one key form of support provided by librarians to teachers was access to materials both to support lessons, and to encourage wider reading (itself a key driver of literacy skills).

Even with libraries physically closed, this role has continued, for example at the Marisa Escola Social Santa Monica in Brazil, where the library engaged closely with teachers in their lesson planning to identify and provide access to appropriate materials. With so many materials available on the internet, help in finding the right ones has been strongly appreciated.

Similarly, the Portuguese School Libraries Network created consultation hours where teachers could approach school librarians in order to identify available materials for lessons. Meanwhile in Massachusetts, United States, school librarians joined teacher Zoom meetings in order to understand needs, as well as proactively reaching out to set out how they could help.

Other libraries have stepped up, with the National Library of Spain for example expanding and promoting its offer of curated materials to support education.


Continued Support for Literacy: another key way in which libraries support teachers is by helping develop the wider literacy skills that ensure that students can engage more effectively with other subjects on the curriculum. School and public libraries in Malaysia, for example, have used social media and other tools to advance the country’s wider programme for reading promotion, eNILAM.

School libraries have worked to make the most both of physical and digital collections, even under pandemic conditions. For example, Roosevelt Elementary School in Lakewood, OH, United States set up a ‘book-grab’ service based on a virtual school library, looking to give children as strong a sense of continuity as possible, alongside activities such as ‘battles of the books’.

Children have also, of course, benefitted from work in public libraries to maximise access to collections, develop online storytimes, and in particular, to deliver digital library cards thanks to agreements between schools and libraries.


Wider Skills Provision: libraries have also been working hard to realise their potential in providing after-school or other extra-curricular learning opportunities that complement what children learn in school. For example, in Portugal, libraries have coordinated with schools in order to run programmes that start soon after school hours, in order to keep children engaged and learning.

Arlington libraries, VA, USA have encouraged children to create ’quaranzines’ in order to express their creativity and share their experiences, while the National Library of Jamaica has developed programming focused on helping students towards their exams.

While activities such as summer reading challenges (in the northern hemisphere) have often not been possible in person, this has not stopped libraries running programmes online, with the National Library of France running events every week in coordination with the Ministries of Culture and Education. Meanwhile, in the US, libraries are finding new ways to run maker-spaces, teach STEM skills or promote information literacy and critical thinking.


These examples of course only scratch the surface. As such, they give just a tiny view of all that libraries can do – and are doing – to help teachers during extraordinary times. Across these, the value of close cooperation between teachers and librarians appears clear, both in order to ensure that teachers understand what libraries can offer, and librarians understand what teachers need.

As the world looks to imagine a future post-COVID, we can hope that a key part of this will be enhanced cooperation with libraries. As we have seen, when cooperation succeeds, students stand to benefit, reducing the risk of long-term negative impacts from the COVID-19 pandemic.

Library Stat of the Week #38: 15 year-olds with access to a library tend to be a year ahead in reading skills than those without

Today marks the beginning of School Library Month, and so it’s a great moment to be looking at available data about the connections between libraries and school performance at the global level.

In last week’s Library Stat of the Week, we used Library Map of the World data concerning numbers of school libraries and compared it with data from the Organisation for Economic Cooperation and Development’s Programme for International Student Assessment (OECD PISA).

This week we look further into the PISA data, in particular that from the 2009 assessment which included a number of questions focused on libraries. While this data was the subject of brief analysis in reports published at the time, little else appears to have been written about this.

PISA as a whole is based not only on practical tests of students’ ability in reading, maths and science, but also includes a lot of contextual questions about issues such as students’ background, habits, and the resources available to them.

As such, the results make it possible to look directly for links between reading performance and the presence and use of libraries in schools, based on results from the same students.

This week, therefore, we start by looking at the overall connections between whether students report having access to libraries, and average literacy scores.

Graph 1 displays this for all countries providing data. The length of the bars indicates the difference in points on the PISA reading scale between 15-year-olds reporting that they do, and do not, have access to a library.

A longer red bar to the right indicates a larger gap in favour of 15-year-olds with access to a library, whereas a blue bar to the right indicates a gap in favour of 15-year-olds without access to a library.

Graph 1: Difference in Literacy Scores Between 15-Year-Olds With and Without Library Access


The key lesson from here is that across all of the countries surveyed, there is, on average, a 30 point gap in favour of 15-year-olds with access to a library. This represents roughly a year’s worth of education.

At the top end, Hungary and France both indicate score differences of over 90 points (around 3 years of learning), and a further seven countries have score differences over 60 points (around 2 years). Only seven countries see students reporting no access to libraries as scoring higher than those who do.

Graph 2: Library Access Gaps and Literacy Scores

Graph 2 looks further, comparing the figures shown in Graph 1 (on the horizontal (x) axis) with the overall average reading score for each country (on the vertical (y) axis).

Interestingly, this indicates that there is very little connection between the two, implying that at almost every level of overall literacy performance, the positive advantage in favour of students with access to libraries is the same.

Graph 3 digs into the different aspects of the OECD’s measure of reading. In effect, PISA breaks down literacy into three key aspects: access and retrieve information (i.e. find key information within texts), integrate and interpret (understand the meaning of what is said), and reflect and evaluate (cross what is read within texts with existing knowledge).

It also includes scores for both continuous texts (such as articles or books) and non-continuous text (such as often found on websites).

Graph 3: Differences in Scores on Aspects of Reading Skills  (Students With  minus Students Without Library Access

Once again looking at the gap between the performance of 15-year-olds who do and do not report having access to a library, the Graph shows relatively little variation across the different skills. The strongest connection between access to libraries and skills is on ‘access and retrieve’, which may well make sense in connection with the sort of extensive region that libraries can offer.


Overall, the figures here are clearly welcome in terms of supporting arguments about the value of access to libraries. Clearly, correlation is not the same thing as causality, and it is likely that schools and communities that offer libraries may well also invest in offering other forms of support.


Find out more on the Library Map of the World, where you can download key library data in order to carry out your own analysis! See our other Library Stats of the Week! We are happy to share the data that supported this analysis on request.

Library Stat of the Week #37: The connection between having access to a library and enjoyment of reading is strongest among children in Austria, France and Montenegro

Last week’s Library Stat of the Week looked at the connection between numbers of school libraries and levels of enjoyment of reading, combining data from IFLA’s Library Map of the World and the OECD’s PISA study.

As highlighted, simply counting the number of students per school library has limits as an indicator of the strength of the sector, as it depends heavily on the structure of schools as a whole.

It also does not account for the number of staff. As we have seen with public libraries in various previous posts, numbers of public and community library workers tend to be more closely linked to positive outcomes, such as literacy and equality.

An alternative perspective can come from digging deeper into the OECD’s PISA data. There is in fact a wealth of information specifically about libraries, based on their 2009 survey.

This post will therefore be the first of a series looking into the lessons we can gain from this source. Picking up on last week’s theme, this week’s blog looks at the links between students’ access to libraries – and use of them – and their level of enjoyment of reading.

As highlighted last week, this matters, as enjoyment of reading in turn is associated with higher overall reading performance.

Graphs 1a and 1b look at the data on the difference in level of enjoyment of reading between students who do, and do not have access to a library.

Graph 1a: Difference in Enjoyment of Reading Between Children With and Without Library Access

Graph 1b: Difference in Enjoyment of Reading Between Children With and Without Library Access

Given the number of countries, it is divided into two graphs, with countries organised according to the gap in levels of enjoyment of reading – the first graph shows countries where the difference in levels of enjoyment is highest.

We can therefore see that this is highest in Austria, Taiwan (China), France and Montenegro. In almost all countries, those who have libraries tend to enjoy libraries more than those don’t.

There are some exceptions though. Yet simply having a library does not mean that it is used. In order to dig further, it makes sense to look at how different types of library use are linked with enjoyment of reading.

Graphs 2a and 2b therefore look at the connection between how regularly 15-year-olds borrow books for fun, and their level of enjoyment of reading.

Graph 2a: Library Borrowing for Pleasure and Level of Enjoyment of Reading


Graph 2b: Library Borrowing for Pleasure and Enjoyment of Reading
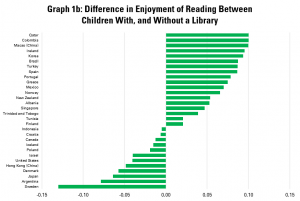
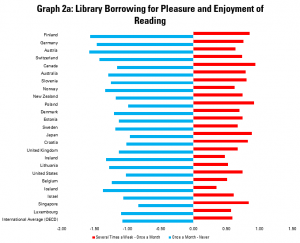
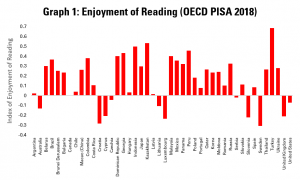
These graphs indicate levels of enjoyment of reading amongst 15-year olds who borrow books only once a month, compared to those who do so never, and those who do so several times a week.

In these graphs a longer blue line to the left indicates that there is a bigger gap in enjoyment of reading between occasional borrowers (once a month) and those who never read. A longer red line to the right indicates a bigger gap in enjoyment between very regular borrowers (several times a week) and occasional ones (once a month).

It is not a surprise of course that there is a connection between the two here – in every country, those who borrow more enjoy reading more. Interestingly, in general, the gaps are bigger between occasional library borrowers and those who never borrow, rather than between the more frequent and the occasional borrowers.

It is in Finland, Germany, Austria and Switzerland where the links between regularity of borrowing books and enjoyment of reading are strongest. The implication here is that building up a habit of library borrowing can correlate with enjoyment of reading.

Graph 3a: Library Use for Homework and Enjoyment of Reading


Graph 3b: Library Use for Homework and Enjoyment of Reading
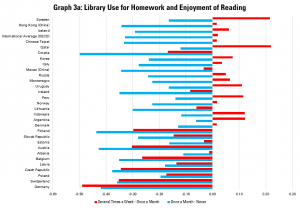
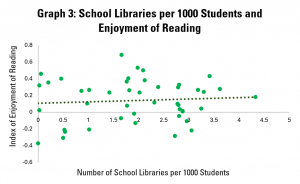
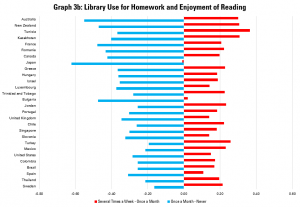
Graphs 3a and 3b look at the links between levels of enjoyment of reading and how often students use the library to carry out homework.

In these graphs a longer blue line to the left indicates that there is a bigger gap in enjoyment of reading between those who occasionally use the library to do homework (once a month) and those who never do. A longer red line to the right indicates a bigger gap in enjoyment between very regular users of the library for homework (several times a week) and occasional ones (once a month).

As can be expected, the difference between level of enjoyment of reading between those who use libraries to do homework regularly, and those who don’t, are less marked than in the previous example.

Nonetheless, the connection is positive in all but one country, suggesting that having library spaces which are suitable for children to do homework is associated with more positive attitudes toward reading. Australia and New Zealand see the most positive connections in this regard.

Graph 4a: Reading for Fun at the Library and Enjoyment of Reading


Graph 4b: Reading for Fun at the Library and Enjoyment of Reading
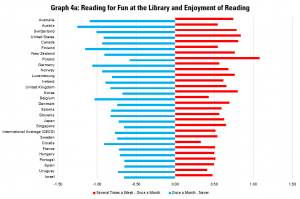
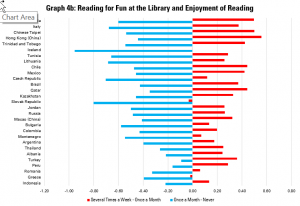
Finally, graphs 4a and 4b look at the links between enjoyment of reading and using the library to read for fun. Again, it is expected that more regular reading for fun at the library is linked to greater enjoyment of reading in general.

In these graphs a longer blue line to the left indicates that there is a bigger gap in enjoyment of reading between those who occasionally use the library to read for fun (once a month) and those who never do. A longer red line to the right indicates a bigger gap in enjoyment between very regular users of the library to read for fun (several times a week) and occasional ones (once a month).

In every country, the link is positive. As with borrowing of books, it also seems that there are bigger gaps between those who visit occasionally and those who never visit, than between the most regular users and more occasional ones.

Again, Australia, followed by Austria, Switzerland and the United States, has the most dramatic links between reading for fun at the library and enjoyment of reading overall.

This would support the argument that work to promote reading for fun in libraries can have a positive long-term pay-off.


In sum, the OECD data, even if a little old now, nonetheless provides valuable evidence of the connection between access to – and use of – libraries by school children, and enjoyment of reading.

Next week, we will look at how this translates into results in terms of literacy scores.


Find out more on the Library Map of the World, where you can download key library data in order to carry out your own analysis! See our other Library Stats of the Week! We are happy to share the data that supported this analysis on request.

Library Stat of the Week #36: Where there are more school libraries, children enjoy reading more

The Gates Foundation’s Goalkeepers 2020 report, published earlier this week, highlights the risk that literacy could suffer as a result of the COVID-19 Pandemic.

It presents different projections, suggesting that the share of children finishing primary school with the ability to read and understand a basic text could fall back to 2015, or even 2010 levels.

This has important knock-on effects, with children then struggling to engage with other subjects at school, achieving less, and finding it harder to integrate into the labour market later in life.

A key determinant of literacy, as underlined in the OECD’s Programme for International Student Assessment (PISA) is enjoyment of reading outside of school. In turn, a key argument made in library advocacy is that our institutions – both public, and embedded in schools, can help build a love of reading.

There have been a good number of studies exploring the connection between school libraries and reading performance at the local level. But what does the data say at the global level?

To explore this, we have brought together information from the IFLA Library Map of the World, as well as OECD PISA data, which used surveys of students alongside tests to find out about habits related to reading.

Graph 1, as a first step, looks at average levels of enjoyment of reading among 15 year olds in participating countries, based on data for 2018. The higher (more positive) a bar is, the more children in the country, on average, report enjoying reading.

Graph 1: Enjoyment of Reading (OECD PISA)

This underlines strong variation between countries, with 15 year olds in Turkey, Kazakhstan, Peru and Indonesia displaying the highest level of enjoyment of reading, while those in Denmark, Croatia and Sweden were less keen.

It is worth noting that total figures, as displayed here, cover varying levels of enjoyment within populations (and indeed, it is on this basis that the OECD can show links between enjoyment and literacy).

Graph 2 turns to the number of school libraries per student. Combining UNESCO Institute for Statistics data with that from the IFLA Library Map of the World data, we can work out how many school libraries there are for every 1000 children enrolled in primary or secondary schools.

Graph 2: School Libraries per 1000 students

For countries for which we have data, there are an average of 1.81 school libraries per 1000 students. Within this, there is strong variation, with the largest number of school libraries per student being found in Poland, Georgia, Moldova and Ukraine.

Graph 3 brings this data together, with numbers of school libraries per 1000 students on the horizontal (X) axis, and the enjoyment of reading index on the vertical (y) axis.

Graph 3: School Libraries per 1000 Students and Enjoyment of Reading

This indicates a positive correlation between numbers of school libraries and enjoyment of reading, demonstrated by the gently rising line. This indicates that in general, where there are more school libraries, enjoyment of reading.

Clearly, however, there are limitations to this finding. First of all, not all countries operate with school libraries, with public libraries taking up their role. And of course, having more school libraries may be part of a wider strategy to promote reading, including through different techniques for promoting this.

They may also organise schools differently, with larger or smaller institutions, which will affect the number of libraries per student. Finally, data on school library workers is limited, meaning that is it not possible to carry out analysis using this.

Future editions of Library Stat of the Week will dig deeper into the available data on school (and public) libraries, and results from OECD’s work on reading habits and performance among children.


Find out more on the Library Map of the World, where you can download key library data in order to carry out your own analysis! See our other Library Stats of the Week! We are happy to share the data that supported this analysis on request.

Library Stat of the Week #22: Where there are more public and community libraries, foreign-born, foreign-language migrants experience a smaller literacy gap compared to native-born, native-language peers

In our Library Stat of the Week mini-series on libraries and equality, we have looked so far at economic inequality, educational equality, and gender equality.

Through different blogs, we’ve explored the interaction between these and numbers of public and community libraries and librarians.

One factor which all too often correlates with poorer outcomes is immigrant status. In addition to difficulty in getting used to a new culture and language, or trying to get qualifications recognised, they can also face discrimination in different dimensions of life.

There are various ways in which libraries can help, from helping newcomers to feel at home and promoting tolerance and inclusion more broadly in society. A crucial way they can make a difference is by supporting literacy by helping newcomers.

To do this, we can use data from the OECD’s Programme for the International Assessment of Adult Competences (PIAAC), which assesses literacy, numeracy and problem-solving capabilities. In carrying this out, the OECD also collected data about whether respondents were native- or foreign-born, and whether they spoke the primary native or another language as a mother tongue.

We crossed this data with numbers of public and community libraries and librarians (and related staff) from IFLA’s Library Map of the World.

Public/Community Libraries and Library Workers vs the gap in average literacy scores between native-born and foreign-born adults

In a first step, we looked at the ‘gap’ between average literacy scores between native- and foreign-born adults, as shown in Graph 1.

Each dot represents a country for which data is available, with higher scores on the vertical (Y) axis indicating a wider gap (and so worse outcomes for foreign-born adults compared to native-born ones. Figures for the gap are adjusted to control for age, gender and educational level.

The results are relatively inconclusive, with little correlation between numbers of public and community libraries and library workers, and the gap.

However, this is to forget that in many cases, a large share of immigrants come from countries where the native language is the same, or at least where the language of the welcoming country is common.

Public/Community Libraries and Library Workers vs the gap in average literacy scores between native-born/native-language and foreign-born/foreign-language adults

In Graph 2, we can address this by looking at the gap between native-born, native-language adults, and foreign-born, foreign-language adults. The difference is significant, with a much stronger correlation between greater numbers of public and community libraries and smaller gaps.


Indeed, for every 10 extra libraries per 100 000 people, the gap in literacy falls by 5.82 points on the PIAAC scale. There is a less obvious correlation with the number of librarians.


As is always noted in this series, there is a difference between correlation and causality, and this analysis does not make it possible to assess what other factors may be at play. As ever, more libraries (and librarians) may be a symptom of a society that has invested more in general in integration and inclusion.


It is nonetheless the case that where there are more public and community libraries, foreign-born, foreign-language migrants tend to face less of a disadvantage in literacy levels compared to native-born, native-language adults.


This could be explained by the possibility that libraries offer to develop language skills, either simply through access to books, or through programming (although the fact of no correlation with the number of librarians may weaken this point).


The fact of much weaker correlation in Graph 1 does at least underline that the potential of libraries as drivers of inclusion in general, beyond language, is not being realised. This is certainly an area where more can be done.


Find out more on the Library Map of the World, where you can download key library data in order to carry out your own analysis! See our other Library Stats of the Week! We are happy to share the data that supported this analysis on request.

Library Stat of the Week #21: Where there are more public and community librarians, the gender skills gap among adults is lower

Two weeks ago, we looked at data on adult literacy levels from the Organisation for Economic Co-operation and Development’s Programme for the International Assessment of Adult Competences (PIAAC), in order to explore the potential relationship with the coverage of public and community libraries in countries.

In that post, we explored the numbers of adults scoring at or below a basic level of skills, as well as the gap between the most and least literate in a population.

However, PIAAC, data also allows us to break things down further, including by gender. This has been a particularly interesting area of study, given that while girls tend to score better on literacy at school (as demonstrated by the results of the OECD’s Programme for International Student Assessment (PISA)), they too often face disadvantage on the job market.

One argument noted by the OECD itself is that the jobs that women tend to be encouraged to take up make fewer demands of their skills, and so there is less opportunity to develop these. This is clearly not an ideal situation, given the implication both that women have fewer chances to learn throughout life, but also the loss this represents to societies and economies as a whole.

As has been highlighted in each Library Stat of the Week post focused on skills issues, public and community libraries do have an important role both in helping to maintain literacy skills (through access to materials and activities), but also in providing a second chance for those who have done less well in school.

This week’s post therefore looks to compare OECD data about adult gender literacy gaps (calculated by subtracting the mean literacy score of women from that of men – a negative result means that the average women has higher skills than the average man) and numbers of public and community libraries and librarians per 100 000 people from the IFLA Library Map of the World.

It is worth noting that the data here comes primarily from OECD Member States, with each of the dots in the graphs below representing a country.

Graph 1 - Public/Community Libraries and Librarians and the Adult Gender Literacy Gap

In Graph 1, we look at data for adults of all ages surveyed (15-65). When looking both at numbers of public and community libraries and librarians, there is correlation, with more libraries/librarians tending to mean that women on average have higher literacy skills than men.

The correlation is stronger when looking at librarians as opposed to libraries – an observation that has also appeared in previous blogs.

As ever, correlation does not always mean causality. In particular, the size of gender gaps above may be influenced by investment in high-quality and inclusive schools (something which is also likely to correlate with investment in libraries).

A next step then is to look at differences over time, given that the advantage that may come from high-quality education will diminish over time, and other factors – such as the presence of public and community libraries – will count for more.

Graph 1 - Public/Community Libraries and Librarians and Evolutions over time in the Adult Gender Literacy Gap

Graph 2 does this by looking at the evolution of the adult gender literacy gap between 15-24 year olds and 45-65 year olds.

On the vertical axis, a score above zero indicates that the gap between men and women is more favourable to women among 45-65 year olds than among 15-24 year olds, whereas a score below zero implies a wider gap among older than among younger adults.

The graph suggests that there is a positive correlation between numbers of public and community library workers per 100 000 people and stability or improvement in the adult gender literacy gap over time.

Clearly, as ever, there can be other explanations – countries which have seen improvements in the gender gap (in favour of women) may also have a range of policies in place that support life-long learning, and a more equitable employment situation for women.

Nonetheless, the correlation is a welcome support for efforts to ensure that libraries are a part of any government strategy to promote gender equality.


Find out more on the Library Map of the World, where you can download key library data in order to carry out your own analysis! See our other Library Stats of the Week! We are happy to share the data that supported this analysis on request.

Library Stat of the Week #19: Countries with more librarians tend to have fewer low-skilled adults

So far, our sub-series of Library Stat of the Week posts focused on equality has looked only at income inequality (see #16, #17 and #18).

Yet income is often an indicator, rather than a cause, of inequalities in society, even if it can also reinforce them. Therefore, some people may have low revenues while others have high ones for a number of reasons – health, unemployment, a lack of entrepreneurship opportunities.

A key driver of course is education and skills – human capital. These affect the ability of individuals to take up quality jobs, or to start their own businesses, as well as to benefit fully from the information around them.

At a societal level, skills increase the productive potential of economies, while also contributing to civic engagement and participation.

Inequalities in skills – as well as larger numbers of people with lower levels of skills – can therefore lead not only to inequalities in employment and earnings, but also differing levels of involvement in civic life.

While schools of course have a major impact on levels of literacy among children, the role of libraries – in particular for literacy – is arguably stronger among adults.

Both through providing continuing access to books in order to maintain levels of literacy, and focused learning opportunities, libraries are major players in lifelong learning, in particular for those who may not have access to training through their employment – or the resources to pay for continuing education.

Therefore, for our 19th Library Stat of the Week, we wanted to look at the relationship between the measures of adult skills created through the Organisation for Economic Cooperation and Development’s (OECD) Programme for the International Assessment of Adult Competences (PIAAC), and data from IFLA’s Library Map of the World on numbers of public and community libraries and librarians per 100 000 people.

In doing this, we focused in particular on figures on literacy inequality (the points gap between the 5th and 95th percentiles – i.e. between the person with the 5th from lowest and the 5th from highest skills in a representative sample of 100 people from the group), and the share of the population scoring below Level 1 on the PIAAC scale (i.e. with very low skills).

Public and Community Libraries and Librarians vs Skills Inequalities (Points Gap between 5th and 95th Percentile)

The first comparison looks at points gaps between the 5th and 95th percentiles. With each dot representing a country for which both PIAAC and Library Map of the World data is available, a higher figure for the points gap indicates greater inequality in levels between the most and least literate.

The comparison here indicates that that there is, a broad correlation in particular between numbers of public libraries and adult literacy inequality, with more libraries tending to mean less inequality.

While there are some countries with low inequality and low numbers of libraries, there are none with lots of libraries and high inequality. The correlation is, however, weaker between numbers of librarians and literacy inequalities.

Secondly, we can look at the shares of low skilled adults in different countries and numbers.

Public and Community Libraries and Librarians and Shares of Low-Skilled Adults (scoring at Level 1 or less on the OECD PIAAC Scale)

This graph tells a slightly different story. Here, it is the number of librarians that sees the strongest correlations, with more public and community librarians tending to be associated with fewer adults with particularly low literacy. Meanwhile, the relationship is weaker between numbers of public and community libraries, and numbers of low-literate adults.

Once again, there are outliers, with some countries managing low shares of low-skilled adults without higher numbers of librarians, but no country with higher numbers of librarians or libraries also had high shares of less literate adults.


As ever, correlation is not causality, and societies that invest more in ensuring that everyone has access to skills may well also be more likely to invest in libraries and library staff.

Nonetheless, the data would fit with the evidence from the ground that libraries provide a means for people of all ages to maintain their literacy skills, and that library workers, through their understanding of community needs, can help those most in need of support.


Find out more on the Library Map of the World, where you can download key library data in order to carry out your own analysis! See our other Library Stats of the Week! We are happy to share the data that supported this analysis on request.