In the past two weeks, we have explored the figures that IFLA’s Library Map of the World offers us on the subject of academic libraries and library workers. We have looked at how many there are in different parts of the world, including relative to population, and last week, as correlations between numbers of libraries and librarians, and scientific publications and patents.
In the third and final post of this mini series, we take the analysis of the last point a little further, in order to see whether the positive correlation seen in particular between numbers of academic library workers per head and publishing survives when another key factor is taken into account – the overall strength of an economy.
There is a strong reason for doing this. Graph 1 compares numbers of scientific and technical publications per 100 000 people (based on World Bank data) with calculations of Gross Domestic Product per person (adjusted for purchasing power) (also based on World Bank data).
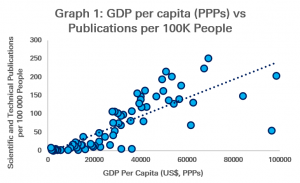
There is a very strong correlation here. This is perhaps not surprising, given that richer economies are better able to allocate resources to support higher education and research, and of course also offer a larger market.
Nonetheless, the correlation isn’t perfect, suggesting that other factors may affect numbers of publications, other than GDP.
Interestingly, in addition, the correlation between GDP per capita and publications per 100 000 people is much stronger than that between total government spending on research and development and publications.
Secondly, we can look at the relationship between numbers of academic library workers and levels of GDP. Graph 2 does this, showing, again, a positive correlation, but this time a less strong one.
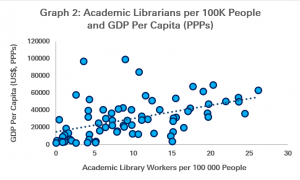 In other words, while in general, richer countries tend to have more academic library workers, this is not always the case. Some very rich countries have relatively few, while some poorer countries have relatively many.
This opens up the question of whether there may be any positive connection between numbers of academic library workers and publications, even when we hold GDP constant. We do this, in Graph 3, by calculating how many more or fewer publications a country is producing in relation to the overall trend, and comparing this with figures for academic library workers.
 In this graph, a negative figure on the vertical axis indicates that they are producing relatively few publications for their level of GDP per person, while a positive one indicates higher publishing rates.
As we can see, there is a gentle positive correlation here. While it is not a dramatic one, this does provide a suggestion that investing more in libraries (as a key part of the research and education infrastructure) may help drive numbers of publications.
Finally, we can go a step further and look not only at relative numbers of publications compared to what would be expected at a given level of GDP per capita, but also at which countries have a relatively high number of academic librarians given their GDP per capita.
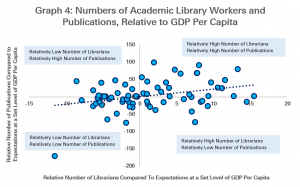
Graph 4 does this, taking the numbers already used for the vertical axis in Graph 3, and making new calculations, based on the average trend found in Graph 2, in order to work out whether countries have more or fewer academic library workers than expected at their level of GDP per capita.
This exercise reinforces the conclusion in Graph 3, suggesting that in two countries with the same level of GDP per capita, the one which has more academic librarians will tend to out-perform one with fewer, in terms of number of scientific publications.
Clearly, this is a point that would need further analysis in order to come to any firm conclusions of course, including study at a more detailed level, in order to see to what extent correlation could mean causality. Nonetheless, it is a welcome piece of evidence for use in advocacy.
Find out more on the Library Map of the World, where you can download key library data in order to carry out your own analysis! See our other Library Stats of the Week! We are happy to share the data that supported this analysis on request.
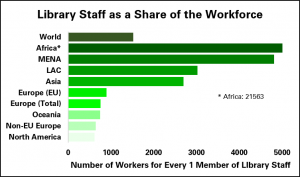
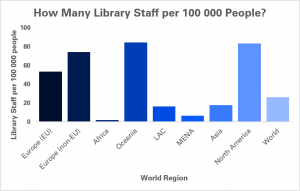
 Last week, we looked at the number of librarians for every 100 000 people around the world, with Oceania coming in highest at 84 – that’s one in every 1190 people.