Tag Archives: academic library

Library Stat of the Week #31: Where there is more librarian support, the share of women completing degrees compared to men is higher

In last week’s Library Stat of the Week,  we looked at the relationship between the number of librarians per student and per researcher, and rates of completion of studies and publication per researcher respectively.

This week, we dig a little deeper into the first of these two questions by using gender dis-aggregated data for completion rates from the OECD.

In effect, this allows us to understand whether greater levels of academic or research librarian support for students (calculated by the number of students each librarian serves) can be associated with a more or less favourable gender gap for women.

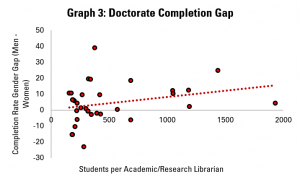
Graphs 1, 2 and 3 do this for students at bachelor’s, masters and doctoral levels respectively. In each graph, each dot represents a country for which data is available.

On the horizonal (X) axis, there is the number of students per librarian. Countries which are more to the left have fewer students per librarian (a proxy for better librarian support), while those on the right have more students (and so less librarian support).

On the vertical (Y) axis, there is the result of subtracting the completion rate for women from the completion rate for men. A figure above zero indicates that a greater share of men complete their studies than women, while a figure below zero suggests that more women finish than men.

Graph 1: Bachelors Degree Completion Gap


Graph 2: Masters Degree Completion Gap

Graph 3: Doctoral Degree Completion Gap
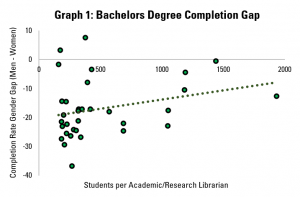
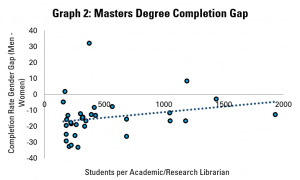
Across the three graphs – and so at all levels of study – it appears that where there is greater level of support from librarians (i.e. each librarian has fewer students to support), the gender gap is more favourable to women.

In terms of the strength of the relationship, it is relatively similar across the levels, with the closest correlation seen at doctoral level (which may make sense, given the intensity of research required for this).

Outside of library support, it is noticeable that while the gender gap tends to favour women at bachelors and masters level, more men tend to complete their doctorates than women.

As part of any gender equality strategy, efforts to ensure that more women get the qualifications needed to get into the highest skilled jobs are likely to play a key role. At the doctoral level, there is clearly work to be done. It could be worth looking further at the role that stronger libraries services can play in ensuring that women get the support needed to complete their studies at this level.


Find out more on the Library Map of the World, where you can download key library data in order to carry out your own analysis! See our other Library Stats of the Week! We are happy to share the data that supported this analysis on request.

Library Stat of the Week #28: On average, there are 305 students and 20 researchers per academic library worker

In recent weeks, we have looked at how numbers of academic libraries and library workers stand around the world, and what correlations there are between these, in relation to total populations, and indicators of innovation such as publishing and patenting.

Another angle worth exploring is the relationship between numbers of academic library workers, and those who benefit most directly from their services – students in tertiary education and people working in the research sector.

We can start to explore this by looking at data from the UNESCO Institute for Statistics on numbers of people working in research, and OECD data on the number of people registered in tertiary education, combined with data from IFLA’s Library Map of the World.

In each case, there is not data available for every country. In particular, OECD data is focused on its own members, with a few additional countries, meaning that averages offered are only relative to a part of the world.

Graph 1: Number of Students per Academic and Research Library Worker

Graph 1 looks at students. Students can benefit strongly from well-supported academic libraries, in order to help them benefit from well-designed collections, find resources effectively, and develop key skills.

The data available indicates that on average, each full-time academic library worker serves 207.7 students. The smallest number of students per librarian was in Germany – 157.6, with eight countries in total coming below the global average, of which seven are European, and the other is Canada.

Among other regions for which data is available, Colombia had the smallest number of students per librarian in Latin America and the Caribbean, and Japan in Asia-Oceania. There are some very high figures for numbers of students in some countries, which may be due to under-counting.

Graph 2a: Number of Researchers per Academic and Research Library Worker


Graph 2b: Number of Researchers per Academic and Research Library Worker

Graphs 2a and 2b look at research personnel (to note different scales on the vertical axis). As has been underlined in previous posts, libraries are a key part of the research infrastructure for any country, not only ensuring that researchers can access knowledge and ideas from elsewhere, but also increasing helping to ensure effective dissemination and management of data.

Globally, the data indicates that there are on average 20 research workers for every worker in an academic or research library.

The smallest number of academic and research library workers per researcher was in Colombia, with 0.6. Eight countries in total have fewer than five researchers per academic and research library worker – as well as Colombia, Panama, Kazakhstan, Honduras, Zimbabwe, Trinidad and Tobago, Mexico and Mauritius.

Meanwhile, a number of countries had figures of more than 100 researchers per academic or research librarian, although this may be down to under-reporting of numbers of librarians.


Clearly the profile of academic libraries themselves varies strongly, depending on institutions themselves. Some will focus much more on educating undergraduates, others much more on supporting more advanced research work.

As a result, a low number of researchers per librarian can be an indicator as much of a large number of librarians (because of strong investment in research libraries) as of a small number of researchers (because a institutions has relatively little focus on research, and more on teaching in general).

A similar reflection can apply to numbers of students. A system more focused on research may therefore employ more research librarians, raising the ratio of library workers to students, but so too could a smaller number of students.

We will explore these issues further next week.


Find out more on the Library Map of the World, where you can download key library data in order to carry out your own analysis! See our other Library Stats of the Week! We are happy to share the data that supported this analysis on request.

Library Stat of the Week #25: At Similar Levels of GDP, Countries with More Academic Librarians See Higher Numbers of Publications

In the past two weeks, we have explored the figures that IFLA’s Library Map of the World offers us on the subject of academic libraries and library workers. We have looked at how many there are in different parts of the world, including relative to population, and last week, as correlations between numbers of libraries and librarians, and scientific publications and patents.

In the third and final post of this mini series, we take the analysis of the last point a little further, in order to see whether the positive correlation seen in particular between numbers of academic library workers per head and publishing survives when another key factor is taken into account – the overall strength of an economy.

There is a strong reason for doing this. Graph 1 compares numbers of scientific and technical publications per 100 000 people (based on World Bank data) with calculations of Gross Domestic Product per person (adjusted for purchasing power) (also based on World Bank data).

Graph 1: GDP per capita (PPPs) and Publications per 100K People

There is a very strong correlation here. This is perhaps not surprising, given that richer economies are better able to allocate resources to support higher education and research, and of course also offer a larger market.

Nonetheless, the correlation isn’t perfect, suggesting that other factors may affect numbers of publications, other than GDP.

Interestingly, in addition, the correlation between GDP per capita and publications per 100 000 people is much stronger than that between total government spending on research and development and publications.

Secondly, we can look at the relationship between numbers of academic library workers and levels of GDP. Graph 2 does this, showing, again, a positive correlation, but this time a less strong one.

Graph 2: Academic Librarians per 100 K People and GDP Per Capita (PPPs)
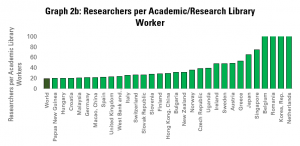
In other words, while in general, richer countries tend to have more academic library workers, this is not always the case. Some very rich countries have relatively few, while some poorer countries have relatively many.

This opens up the question of whether there may be any positive connection between numbers of academic library workers and publications, even when we hold GDP constant. We do this, in Graph 3, by calculating how many more or fewer publications a country is producing in relation to the overall trend, and comparing this with figures for academic library workers.

Graph 2: At Constant GDP. Do More Librarians Mean More Publications?
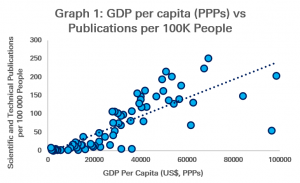
In this graph, a negative figure on the vertical axis indicates that they are producing relatively few publications for their level of GDP per person, while a positive one indicates higher publishing rates.

As we can see, there is a gentle positive correlation here. While it is not a dramatic one, this does provide a suggestion that investing more in libraries (as a key part of the research and education infrastructure) may help drive numbers of publications.

Finally, we can go a step further and look not only at relative numbers of publications compared to what would be expected at a given level of GDP per capita, but also at which countries have a relatively high number of academic librarians given their GDP per capita.

Graph 4: Numbers of Academic Library Workers and Publications, Relative to GDP Per Capita Expectations

Graph 4 does this, taking the numbers already used for the vertical axis in Graph 3, and making new calculations, based on the average trend found in Graph 2, in order to work out whether countries have more or fewer academic library workers than expected at their level of GDP per capita.

This exercise reinforces the conclusion in Graph 3, suggesting that in two countries with the same level of GDP per capita, the one which has more academic librarians will tend to out-perform one with fewer, in terms of number of scientific publications.

Clearly, this is a point that would need further analysis in order to come to any firm conclusions of course, including study at a more detailed level, in order to see to what extent correlation could mean causality. Nonetheless, it is a welcome piece of evidence for use in advocacy.


Find out more on the Library Map of the World, where you can download key library data in order to carry out your own analysis! See our other Library Stats of the Week! We are happy to share the data that supported this analysis on request.

Library Stat of the Week #24: Where there are more academic librarians, there is more publishing and patenting

As highlighted in last week’s post, academic libraries are central to any country’s infrastructure for learning and innovation. Through giving learners and researchers access to existing knowledge, and support to make the most of it, they enable work to happen that leads to social and economic progress.

Last week’s post offered an initial overview of data about academic libraries and library workers in IFLA’s Library Map of the World database, suggesting that there are, on average, 1.32 academic libraries and 10.63 academic library workers per 100 000 people.

Within this, there is strong variation across countries, with, for example, there being 26.25 academic library workers per 100 000 people in the United States, but fewer than 0.1 elsewhere.

What might this mean for the ability of countries to innovate?

In this week’s Library Stat of the Week, we’ll take a first look at data on some common metrics of innovation performance – numbers of scientific publications, and numbers of patents – in order to look for potential correlations.

For this, we can cross data from the Library Map of the World (using figures for numbers of librarians and libraries per 100 000 people), and World Bank data on scientific and technical journal articles, and on patent applications by residents, also translated into figures for numbers per 100 people.

Graph 1: Academic Libraries and Publications

Graphs 1 and 2 do this in the case of publications. The link between the strength of the academic library network and the number of scientific and technical publication is relatively clear, and makes sense intuitively.

Researchers with better access to books, journals and other resources, through libraries, are better placed to write high-quality articles themselves, likely to be accepted in good quality journals.

Graph 2: Academic Library Workers and Publications
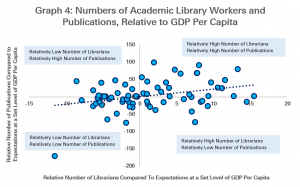
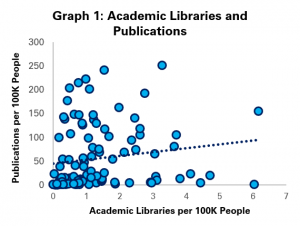
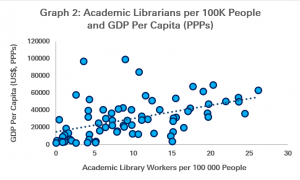
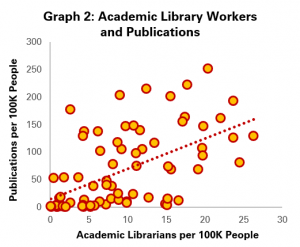
Interestingly, the correlation is stronger in the case of academic library workers (Graph 2) than in that of academic libraries (Graph 1).

It is likely that numbers of library workers is a better indicator of the strength of the field, both given the importance of staff in helping researchers, but also potential variation from country to country in how academic libraries are organised and counted.

While, as always, correlation does not mean causality (a point we will return to below), the graph does at least seem to back up the argument that a stronger library field will tend to support a higher publications output.

The next stage is to look at patents. These are often treated as a key indicator of the innovation performance of countries, given that they can be associated with new products, services and so business.

Graph 3 Academic Libraries and Patent Applications
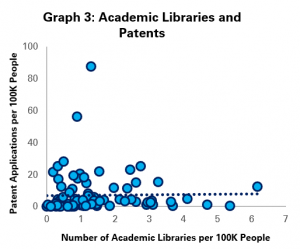
Graphs 3 and 4 therefore repeat the exercise with patent application data, comparing numbers of academic libraries and library workers per 100 000 people.

In this, in order to avoid distortion, some countries with outlying data (notably the extremely high patenting figures for China and South Korea) have been excluded in order to allow for a better look at others.

It is clear that the relationships are less clear with patents than they are with publications. This is perhaps understandable – much patenting activity comes from businesses, while publications tend to come from universities and research centres

It is already clear that correlations are weaker here – indeed, there seems to be little correlation at all between the number of academic libraries and patents at all (Graph 3).

Graph 4: Academic Library Workers and Patent Applications
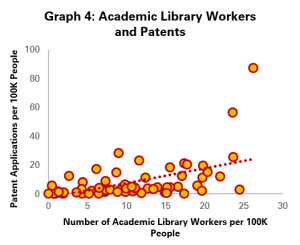
Nonetheless, on the stronger indicator of the strength of academic library fields – the number of academic library workers per 100 000 people (Graph 4) – the correlation does reappear, although is still slightly weaker than with publications.


Overall, these results do support the conclusion that countries which perform better on traditional metrics of innovativeness are also the ones that have a stronger academic library field.

As mentioned above, this is not necessarily the same as causality. In next week’s Library Stat of the Week, we will therefore try to control for some of the other potential factors which might influence this connection.


Find out more on the Library Map of the World, where you can download key library data in order to carry out your own analysis! See our other Library Stats of the Week! We are happy to share the data that supported this analysis on request.