Monthly Archives: January 2021

Was 2020 the Year we Fell out of Love with Information (and Why We Should Make Up in 2021)

2020 was a year of casualties.

Most obviously, there were the million plus people who were lost to COVID-19, and others whose lives were – or risk being – shortened by the consequences of the COVID response on other forms of healthcare.

Screening and vaccination programmes, mental health, and prevention have all suffered.

There have been the pupils and students who have lost weeks or months of formal education, with the highest costs often amongst those who rely most on education as a driver of social and economic mobility.

There has been the economic cost, playing out in businesses closed, jobs lost, and futures upended.

Beyond COVID, the death of George Floyd led to protests that met, often, with a violent response from police. Meanwhile, conflicts continued around the world, and progress towards the SDGs remained insufficient if we are to meet the Global Goals by 2030.

This blog argues that alongside the other casualties, there is a risk that our relationship with access to information may end up being damaged by the events of 2020. However, as it concludes, it is not too late to make it up.


Information as Virus

The first blow came, early on in the pandemic, when the word ‘infodemic’ started to circulate, promoted by the World Health Organization. Others, such as UNESCO, used terms such as ‘disinfodemic’.

Of course in some ways, it is positive to see the power of information recognised in a world where this is arguably all too often taken for granted.

However, the focus in the WHO definition on the idea of an ‘over-abundance’ of information is noteworthy. So too is the implication that information itself (rather than deliberate disinformation, in the case of the UNESCO definition) is a virus.

It seems unlikely that the WHO, given its own positive approach to issues such as open access and science, intended this. However, given libraries’ focus on increasing the amount of information available to people in order to be able to respond to their needs, this is potentially a cause for concern.

From here, it is only a short step to the idea that certain actors should have a monopoly on information provision, with everything else declared invalid or even illegal. This would take us back to the days of only allowing officially sanctioned printing presses – not a desirable move.

If the idea of limiting the amount of information available to people spreads – rather than a focus on providing the guidance and skills necessary to navigate the information available – there is a risk of losing momentum in the drive to bring the benefits of access to information to all.


Information as Potentially Dangerous Good

Closely linked to the concept of an ‘infodemic’ has been the growing pressure on internet platforms to intervene in the sharing of information – and their own readiness to act in response.

Twitter for example updated its policies in 2020, and proved readier to block or label tweets from President Trump. Facebook and others upped their efforts to block misleading content about COVID.

For many though, this has been nowhere near enough, and calls have grown for review of the ‘safe harbour’ provisions that have allowed internet platforms a way to escape liability for content posted by users.

The European Union itself has started the process of updating its own rules, while in the United States, calls to repeal or reform Section 230 are growing louder.

These discussions of course have two angles to them, as the European Union’s own approach recognises. One relates to how to address harmful or illegal content online. The other is a result of the desire to address concerns about unfair competition and impacts on other companies.

However, in the popular discourse, the two issues are rolled together, with changing liability rules for internet platforms seen as a way to solve competition issues. Faced with this, the platforms themselves, as suggested above, have been ready to move to show they are listening and hopefully avoid much more costly competition interventions, such as break-ups or divestments.

Why is this a concern for access to information?

Because a simple shift to increase the liability on the platforms and services that have arguably facilitated much of the explosion in access to information risks leading to the privatisation of the policing of free speech.

In effect, through their terms of use – and their application through pre-emptive filters – platforms would decide what speech is acceptable or not. Without an incentive to promote free expression, the risk of over-blocking is high. Similar rules could end up applying to upstream providers such as ISPs, or even hosting services. As private companies, there would also be fewer requirements for transparency, or opportunities to appeal.

This is indeed an issue already warned about by the former UN Special Rapporteur on Freedom of Expression in 2017. But after 2020, there seems to be a serious risk of it accelerating.


Information as Uncertainty

The final threat to our relationship with information has been the lesson that the pandemic has provided in how knowledge is created and furthered.

We have seen claims made and refuted by scientists, advice issued, changed and updated by governments, and have been faced ourselves with uncertainty in carrying out activities which we previously did unthinkingly.

The pandemic has exposed how incomplete and inconclusive information can be. While this is nothing new for those involved in science, for many, it has not been an easy or comfortable experience.

Rather, it has led to frustration, cynicism, and likely a greater tendency to grab onto the easy answers that conspiracy theories provide.

Clearly, such theories are nothing new, but the pandemic has arguably provided a fertile ground for their spread. These of course can do harm to individuals and groups, as well as to the effectiveness of efforts to tackle the pandemic.

In the longer term, there is a risk that more people are pushed into abandoning curiosity and seeking out easier and more comfortable information. In doing so, they risk falling into the trap explained by Elfreda Chapman in her work on information poverty, rejecting information from outside the group.


Conclusion

The events of 2020 have certainly had am impact on our relationship with information. The idea that there can be too much information, that it is something to be vetted before it is shared, that it is too complicated, all risk making people fall out of love with it.

Faced with this, libraries’ focus on enhancing the amount of information available to people, and focusing on building information skills, can of course risk looking naïve.

There is of course unacceptable information out there – harmful hate speech, abuse, deliberate lies and more. It is not possible to declare that all information is good, and of course, there is no such thing as perfect information literacy or skill.

The question is rather about our starting point in addressing these questions. Do we begin with the position that more information is a positive, unless identified as otherwise, or do we assume that information is bad, unless proven to be acceptable?

Do we put faith in people to be able to navigate their way around information, or do we spoon-feed them?

Do we encourage curiosity, even if it comes with complexity, or rather simply look to make things easy?

For libraries, traditionally, we advocate for the first positions.

While limitations on access and expression may be necessary, these need to be the exception, and applied only when necessary and proportionate, and in a transparent manner. While leaving people room to make up their own minds can lead to mistakes, it is ultimately more desirable than channelling them narrowly. While ready reckoners and simplicity may be attractive, they can set limits on curiosity and innovation.

However, the events of 2020 have seen increasing risks of lawmakers and societies adopting approaches less friendly to access to information. This risks dragging us back to a situation of censorship, slowing efforts to bring people online, chilling expression, and self-imposed information poverty.

As we head into 2021, we need to be able to highlight the costs of over-blocking, censorship and conspiracy theories. But just as importantly, if we want people to come to value and appreciate information, we need to be able to tell the positive stories of how the widest possible access changes lives for the better.
Celebrating the Public Domain 2021

2021 has finally arrived, and as always, the new year brings another celebration: Public Domain Day.

This is a big deal. Why? Because the public domain means that works can be used and modified by anyone without authorisation. As such, this enriches the range of books, articles, art and beyond that brings us pleasure, inspiration and insights without copyright-related restrictions.

This matters for libraries, as institutions focused on maximizing access to information, in particular of works which have been carefully preserved for years.

Why the Public Domain?

All works that reflect the original expression of the mind of an author are protected by copyright law as soon as they are created, for a long time.

Copyright protection has been regularly extended through time. The key international law on the matter – the Berne Convention – establishes protection for the life of the author plus a further 50 years. Yet countries can go further. In 1998, the United States agreed via the Copyright Term Extension Act to extend copyright protection to 70 years after the death of the author. This decision has been followed by additional countries, delaying the entry of works in the public domain, with some offering as many as 100 years of protection after death.

Until these works enter the public domain, they are still subject to restrictions on use, despite that fact that the commercial value of works is generally only in the first few years after publication. As a result, plenty of works are not easily available, and therefore subject to oblivion.
As a result, any extension of protection limits libraries’ ability to provide wide access to works.

Further risks come from the fact that the public domain too often does not exist as a concept in legislation (it is rather implicit, resulting from the lapsing of protections). This can create uncertainty, leaving open the possibility to create new restrictions.

What is Public Domain Day?

Public Domain Day falls on is the first of January of each year and is celebrated during the whole month. It is about celebrating the public domain, recognizing the importance of protecting it, and fostering the use of materials by all communities.

This date was chosen because calculating copyright protection can be complicated. As a result, many countries have decided to simplify it by choosing the 1 January following the anniversary of the death of the author as the release date for works entering the public domain.

As a result, in countries with a copyright term of life plus 70 years, the works of authors who died in 1950 are now in the public domain. Thanks to earlier reforms in US law, books and films released in 1925 have also now lost copyright protection.

What are the next steps?

Are you willing to celebrate the public domain and make the most of it with your Library?

Whether you are in an academic library, a heritage library, or a public library, this is an opportunity to showcase works newly in the public domain. The library can highlight works via a conference, communications on blogs and social media, a wiki edit-a-thon to add these new works in Wikisource or to complete Wikipedia pages.

Several approaches are available:

Pick a specific work that is now in the public domain. Who is the author? Why is this book unique and what did it tell us back in time? And now? Make a thread on social media or share it on your blog!

Build understanding about copyright: this is also a good time to share more about copyright laws, and library issues. Use Public Domain Day to discuss the public domain, common goods and the importance of unrestricted access.

If you are interested in more information, a few articles might be interesting: here, here, here (US), here and here (France), here and here (Spain), here in Colombia, here in Portugal.

Here is the Wikilist of works entering the public domain in 2021.

The 10-Minute International Librarian #33: Make a Library Resolution

It’s a cliché, but the start of a new year is a good time to make plans and commitments.

Before things get too busy, you can identify things you can do differently – and hopefully better – and so grow in your job.

You may not know what the outcome will be, but you can only learn by trying new things!

So for our 33rd 10-Minute International Librarian exercise, make a library resolution.

Pick something you have maybe identified as a person goal in the past year, such as delivering a project, or learning a new skill or developing your knowledge or connections.

You can look back at some of our previous 10-Minute International Librarian ideas so far for inspiration.

A great idea can be to find a way to make your own work and practice more international!

Let us know your resolutions in the comments box below.


This idea relates to the IFLA Strategy! Key Initiative 2.3: Develop standards, guidelines, and other materials that foster best professional practice.

You can view all of our ideas using the #10MinuteInternationalLibrarian tag on this blog, and of course on IFLA’s Ideas Store! Do also share your ideas in the comments box.

Library Stat of the Week #50 (Part 2): Where there are stronger and better used public and community libraries, more people read, more often

In the final post both of this mini-series on libraries and cultural data, and of our regular Library Stat of the Week posts, we return to a core function of libraries – to promote reading and access to books.

In the past three weeks, we have looked at data around how much households spend on books, as well as on wider data around participation in artistic and cultural activities. In each case, it appears that having more libraries, and using them better, is linked to greater spending and engagement.

This week, we look at data on how people spend their time, and in particular on how many people read regularly, and then how long they spend doing it.

For many, simply encouraging more reading is an end in itself, although of course this can also have positive impacts on issues such as wellbeing (a key issue during the pandemic!), literacy (skills can deteriorate if not used) and of course on the health of the wider cultural sector.

Once again, we are drawing on data from Eurostat, and in particular the Time Spent on Cultural Activities dataset (gathered between 2008 and 2015). Given its focus, it only covers countries in Europe, but offers insights that can apply elsewhere. As ever, data on libraries comes from the IFLA Library Map of the World, crossed with World Bank population data.

To set the scene, we can look already at what we know about people’s habits around reading, in particular throughout their lives.

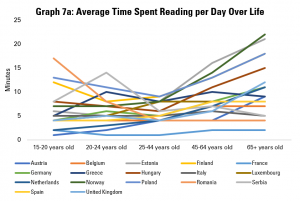
Graph 7a: Average Time Spent Reading per Day Over Life

Graph 7a does this by looking at the average time spent reading per day per person, broken down by different age groups. It shows that, in general, there is a U-shaped curve, with people reading more when they are younger and when they are older, with 25-44 year olds reading least on average.

There are exceptions within this. For example, Romanian 15-20 year olds on average read more than any others in Europe. However, older Romanians (aged 65+) are the second least regular readers. Meanwhile, young Austrians and Dutch are low readers, but their parents and grandparents on average spend a much more average amount of time reading.

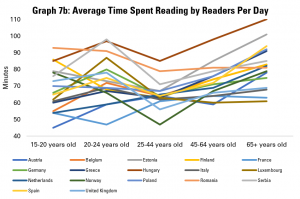
Graph 7b: Average Time Spent Reading by Readers Per Day

Graph 7b looks only at those people declaring that they do read regularly, and explores how long they spend doing this. While there is, again, a dip in average time spent reading among the 25-44 age group, this is less dramatic. Hungarian readers show up across all age groups as one of the nationalities that reads most when they do.

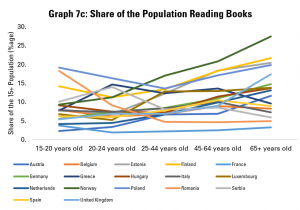
Graph 7c: Share of the Population Reading Books

The other driver of overall figures on how much people read on average is data about the share of the population reading at all. Graph 7c explores this, noting that the share of the population reading in general tends to be relatively stable, or drop between 15-20 and 25-44 year olds, and then rise relatively sharply among older groups. For example, while only an average share of younger Norwegians read, a larger share of older Norwegians than in any other country covered read. Similarly, from coming almost bottom of the class among younger groups, the older Dutch and Austrians come around average when it comes to the share of older people reading.

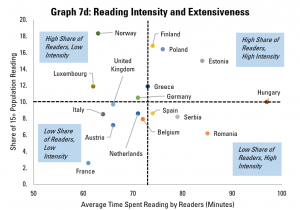
Graph 7d: Reading Intensity and Extensiveness

We can get an overview of the extensiveness (i.e. share of the overall population reading) and intensity (time spend reading by those who do) in Graph 7d, which looks at populations as a whole.

This shows us that Finland, Poland and Estonia do not just have an above average share of readers in the population, but those who do read tend to do so for longer. In contrast, Italy, France, Austria, the Netherlands, Belgium and the United Kingdom have both a below-average share of readers in the population, and those who do read do so for shorter times than average.

Finally, there is a contrast between Norway, Luxembourg and Germany (more readers, but reading for shorter times), and Spain, Serbia and Romania (fewer readers, but those who do read for longer). A separate analysis of the situation for different age groups could also be interesting here, in order to understand whether the main challenge in increasing reading is to allow more time for this, or to get more people reading in the first place.


Having looked at reading habits, it is now time to look at the relationship between libraries and reading.

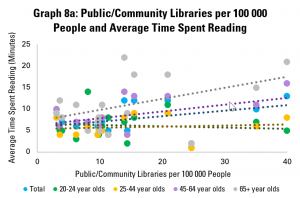
Graph 8a: Public/Community Libraries per 100 000 People and Average Time Spent Reading

Graph 8a looks at the availability of public and community libraries, as measured by the number of libraries per 100 000 people, compared to the average time spent reading by different age groups. It finds that there is a positive correlation for the population as a whole, mainly driven by older readers (those aged 45-64 and 65+). The link is less obvious for younger readers (aged 20-24 and 25-44).

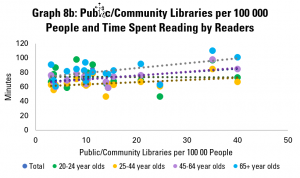
Graph 8b: Public/Community Libraries per 100 000 People and Time Spent Reading by Readers

Graph 8b looks at the amount of time spent reading by those who do read. This again shows a gentle, but positive correlation – in other words, in countries with more public and community libraries, those people who do read tend to spend more time doing so. Looking across age groups, the correlation is positive for all, although only slightly in the case of 20-24 year olds.

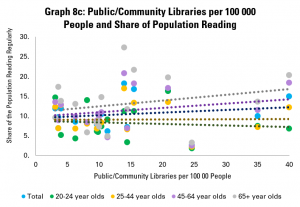
Graph 8c: Public/Community Libraries per 100 000 People and Share of Population Reading

Graph 8c looks at numbers of public and community libraries, and the share of the population in different age groups reading. Again, it finds weak but positive correlation between numbers of libraries and tendency to read, with stronger links for older groups. The picture is similar if we look only at countries with up to 20 public or community libraries per 100 000 people.

Overall, the story from this is that pure numbers of libraries are positively linked with how many people read, and how much they do, but not particularly strongly.

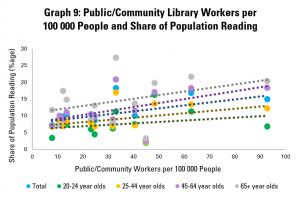
Graph 9: Public/Community Library Workers per  100 000 People and Share of Population Reading

Graph 9 goes a little further, looking rather at numbers of public and community library workers. This is, arguably, a stronger indicator of how much is being invested in the library field, as well as its ability to reach out to readers, welcome them, and support literacy.

This shows a more positive link between the strength of the library field and share of adults reading, with an increase of 10 library workers per 100 000 people tending to be linked to a rise of 1% in the share of the population reading (or 1000 people). This arguably makes sense – library staff have a key role in helping readers find books that interest them, and simply in making libraries into welcoming places.

Once again, the connection is stronger in older groups. Interestingly, it does not appear that those who do read spend more time doing so in countries with more public and community library workers.

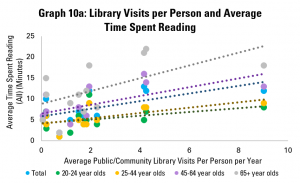
Graph 10a: Library Visits per Person and Average Time Spent Reading

Yet as in previous posts, the strength of the library field is only part of the picture – so too is how well it is used. Graph 10a does this, using data on average library visits per person per year. It shows a positive correlation between library visits and the length of time adults in general spend on reading per year, again with more positive links among older groups.

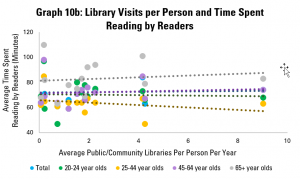
Graph 10b: Library Visits per Person and Time Spent Reading by Readers

Graph 10b looks at how long those adults who read do so on average. Here, the picture is similar to that in Graph 8b, with a weakly positive correlation. Again, it appears that there is little link between libraries and how long people spend reading.

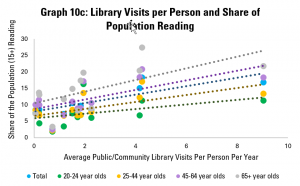
Graph 10c: Library Visits per Person and Share of Population Reading

Graph 10c however looks at the share of the adult population that reads, and once again displays a strong and positive correlation. Across the population as a whole, an increase of one library visit per person per year tends to be associated with a 1.28 percentage point rise in the share of the population reading.

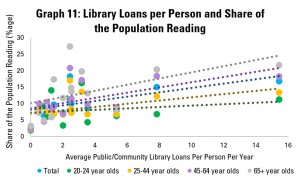
Graph 11: Library Loans per Person and Share of the Population Reading

Graph 11 repeats this last analysis, but with the average number of loans from public and community libraries per person per year. Again, there is a relatively strong positive correlation, with an extra library loan per person per year associated with a 0.6 point rise in the share of adults reading. As in Graph 10c, the connection holds for all age groups, although is stronger for older ones.


What can we conclude from this? First of all, that there are significant differences in reading habits across the European countries surveyed by Eurostat. High performance – as measured by a high average length of time spent reading per person – can be influenced by the number of people reading, and how long they read for. This performance matters, given the role of reading in maintaining and strengthening skills, in promoting wellbeing, and in providing demand for writing.

Looking at the connections with libraries, it seems that there are much stronger links between libraries and the share of the population reading than between libraries and how long people spend reading.

While correlation is not causality, the data shared here would support the argument that libraries can play a role in getting more people reading, and so in helping more people benefit in terms of skills and wellbeing. In particular, numbers of library staff appear to matter more than numbers of libraries, and levels of use of libraries have a stronger link still.

This would imply that a key focus of governments looking to boost reading will likely be to ensure that libraries are well-staffed and welcoming for all.

Throughout, the relationship between public and community libraries and numbers of people reading seems weakest in general for younger groups. To some extent, this may be because many younger people have access to university libraries (in the case of 20-24 year olds in particular), or just because of less inclination to read in general among 25-44 year olds. It can also be underlined that the importance of reading for skills is more important among older groups in any case.

Nonetheless, this does raise interesting questions about whether more can be done to increase reading among 25-44 year olds, and whether libraries can strengthen their role in this.


Find out more on the Library Map of the World, where you can download key library data in order to carry out your own analysis! See our other Library Stats of the Week! We are happy to share the data that supported this analysis on request.