Monthly Archives: December 2020

Library Stat of the Week #50 (Part 1): Where there are stronger, and better used public and community libraries, there tends to be greater participation in artistic and creative activities

In part one of the last of our mini-series on libraries and cultural data – and indeed the last of our regular Library Stat of the Week posts for now – we’re looking at data about libraries and the wider cultural field.

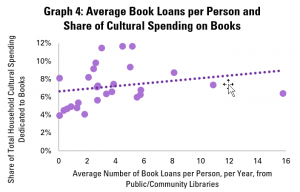
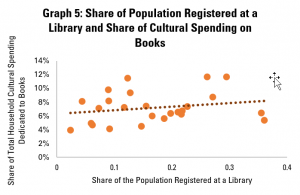
This follows two posts exploring the relationship between libraries and the book sector, measured in terms of the share of household spending on culture going on books across countries for which culture is available.

In this post, we make use of Eurostat data about frequency of participation in artistic activities (in general), and regularity of attendance at cultural events (cinema, live performances, and cultural or heritage institutions such as museums).

Once again, we also draw on data from IFLA’s Library Map of the World, combined with World Bank population data.

Given that Eurostat data only covers Europe, and that Library Map of the World data is not complete for every country, we have limited analysis to those countries for which data is available.

The goal is to explore what relationships exist between the existence and use of libraries and broader cultural participation. The thesis is that libraries can act as a gateway to culture, providing opportunities that are both local, and free, for people to discover creativity, both in others and in themselves.

The first part of this post looks at data around participation in artistic activities, compared to different metrics of availability of libraries (measured by the number of public and community libraries per 100 000 people), and their use (measured by numbers of visits and loans per capita).

Participation in such artistic activities can be used as a proxy for levels of creativity, as well as a broader indicator of the strength of culture.

Graph 1a: Public/Community Libraries per 100 000 People and Frequency of Participation in Artistic Activities

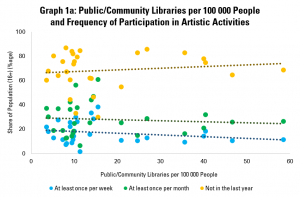
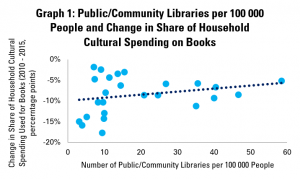
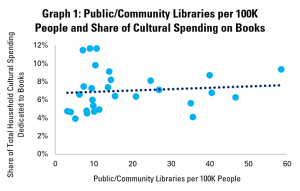
Graph 1a therefore compares the shares of the population reporting that they participate in artistic activities at least once a week, at least once a month, and not at all in the last year, with the number of public and community libraries per 100 000 people.

In this (as in all the graphs in this post), each dot represents one country. The higher up a dot is, the higher the share of people reporting that they practice an artistic activity at a given frequency. The further to the right it is, the more public or community libraries there are per 100 000 people in the country.

This finds little relationship between the presence of public and community libraries and levels of participation in artistic activities.

However, as in previous posts, it is worth looking at just those countries with up to 20 public or community libraries per 100 000 people (above the European and global averages) – this allows us to exclude more extreme cases.

Graph 1b: Public/Community Libraries per 100 000 People and Frequency of Participation in Artistic Activities (up to 20 Libraries per 100K)

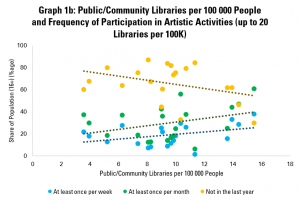
Graph 1b does this, showing a much stronger link between the presence of libraries and participation in artistic activities. More public and community libraries tends to be associated with greater shares engaging regularly in artistic activities (and smaller shares not engaging at all).

For example, every extra public or community library per 100 000 people tends to be associated with a fall of almost 2 percentage points in the share of the population not engaging in artistic activities at all.

Graph 2: Public/Community Library Visits per Person and Frequency of Participation in Artistic Activities

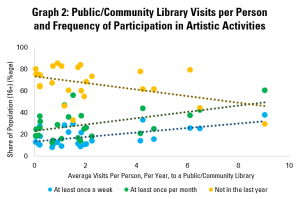
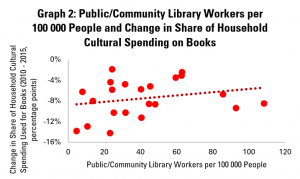
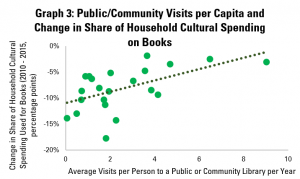
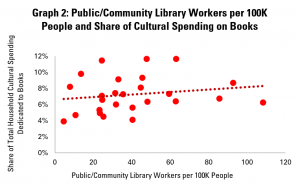
Graph 2 continues the analysis, but looking rather at a key indicator of intensity of use of libraries – the average number of visits per person per year. This finds a similar trend as in Graph 1b, with more regular visits to libraries associated with higher engagement in artistic activities.

Here, every one additional visit to a public or community library per person per year is associated with an almost three point rise in the share of the population engaging in artistic activities at least once a month.

Graph 3: Total Loans per Person and Frequency of Participation in Artistic Activities

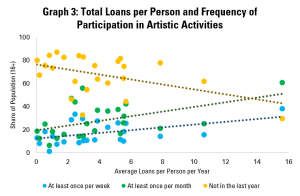
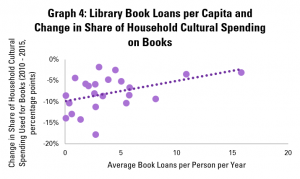
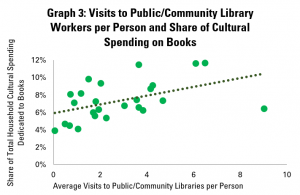
Graph 3 does the same but with the average number of loans per person per year, and again shows that more regular borrowing of books tends to be associated with more regular participation in artistic activities. Each additional loan per person per year tends to be linked with a fall of over two points in the share of the population not engaged in any artistic activity in the past year.

Overall, these graphs underline the connection between the presence and use of libraries, and wider involvement in artistic activities. Clearly, we cannot say for sure say that there is causality in one direction or the other. Indeed, both library use and other artistic activity could be the result of a single cause, such as a strong focus on culture in education or a wider appreciation of being cultured.

Nonetheless, it does support the argument that societies which are more involved in artistic activities – and so which arguably encourage creativity – are characterised by a greater number of public libraries (at least up to around 20 public libraries per 100 000 people), and more intense use of these.


The second part of this post looks at data around frequency of participation in specific cultural activities – namely visits to the cinema, going to live performances (theatre, concerts), and visits to cultural or heritage institutions (including monuments and museums).

This data, as far as it appears, does not include data on library visits. However, it provides an insight into the strength of the wider cultural sector. In particular, larger numbers of people going regularly to the cinema or a live performance, or visiting a cultural or heritage institution, bring advantages in terms of revenues for each of the sectors concerned.

The following analyses look at how the share of the population carrying out these different activities regularly (at least four times a year) compares with numbers of visits to libraries per person per year, as an indicator of how well used libraries are.

Graph 4a: Public/Community Library Visits and Share of 16+ Population Participating in Cultural Activities 4 or More Times Per Year

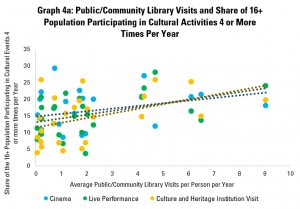
Graph 4a therefore looks at the share of the population aged 16 or more going to each of the three types of cultural event four or more times per year. It indicates a positive correlation – in countries where there are higher average numbers of library visits per year, there are also more people going regularly to the cinema, to live events, or to cultural or heritage institutions.

The most positive correlation here is between visits to libraries and visits to cultural or heritage institutions, with live performances and cinema following closely behind. For every additional library visit per person per year, there tends to be a rise of 1.4 points in the share of the population visiting cultural or heritage institutions regularly.

Graph 4b: Public/Community Library Visits and Share of 16+ Population with Low Education Participating in Cultural Activities 4 or More Times Per Year

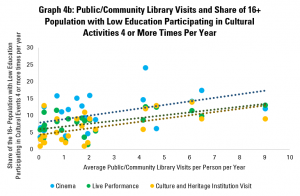
Graph 4b looks specifically at the case of people with lower education (defined as less than primary and lower secondary education), given that people in this situation can be at risk of exclusion. A break-down of this data is not available for libraries, and so data for the whole population is used.

The graph indicates that levels of regular participation in different events or activities are lower than for the population as a whole. However, we see the same positive connections with even stronger correlations between average use of libraries (for the population as a whole), and participation in different activities (for people with lower education).

In other words, there is an indication that there may be links between use of libraries and participation in other events, even for those who may otherwise be at risk of exclusion.

Graph 5a: Public/Community Library Visits and Share of 16+ Population (by Education Level) Visiting Culture and Heritage Institutions Regularly

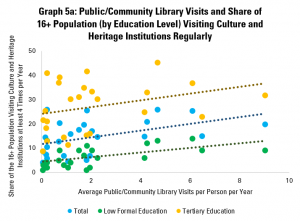
Graph 5a looks specifically at cultural and heritage institutions, given that these are, in other circumstances, often considered as part of a group with libraries (GLAMs). They can also have similar functions as community spaces, where visitors have more freedom to discover for themselves.

In addition to the positive link between library visits per capita and shares of the population as a whole, it helps underline similar positive links for people with both high and low levels of formal education. Interestingly, the strength of the correlation is highest for those only primary and lower secondary education.

Graph 5b: Public/Community Library Visits and Share of 16-29 Population (by Education Level) Visiting Culture and Heritage Institutions Regularly

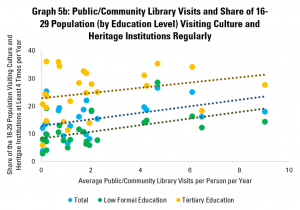
Graph 5b repeats the analysis for younger people (aged 16-29) and comes to a similar conclusion – where there are more visits to libraries per person (again, for the whole population), there tend to be higher numbers of people regularly visiting cultural and heritage institutions.

Graph 6: Public/Community Library Visits and Share of Population (by Age) Visiting Culture and Heritage Institutions Regularly

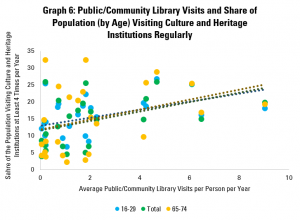
Finally, Graph 6 looks rather at trends for different age groups. This finds very little difference in the relations between library visits (for the whole population) and for the share of younger (16-29 year olds), older (65-74 year olds) and the population as a whole (anyone over 16). In each case, the connection is positive.


This post has looked at different indicators of levels of participation in culture. Maximising this participation can be seen as a goal in itself, a driver of wellbeing for individuals, a support for the cultural sector, and as a foundation for strong economies and societies in general.

While, as always, correlation cannot be read as causality, there certainly are positive links between levels of presence and use of public and community libraries and engagement in artistic activities. The same goes for visits to public and community libraries and regularly going to the cinema, live performances and other cultural and heritage institutions, including across age groups and levels of education.

The data presented here therefore supports the argument that a well-supported and well-used public and community library field tends to be associated with wider participation in artistic and cultural activities, either as a gateway or as a complement. It can help support arguments for libraries to be considered as a key part of cultural policy, as a support for the wider creative economy, and indeed as actors in boosting creativity in general.

Part two of this post will look, finally, at data around the strength and use of public and community libraries and reading habits.


Find out more on the Library Map of the World, where you can download key library data in order to carry out your own analysis! See our other Library Stats of the Week! We are happy to share the data that supported this analysis on request.

The 10-Minute International Librarian #32: Say thanks to all those who have helped you

It’s often said that libraries are instinctively collaborative institutions.

This takes place concretely through activities such as document supply or inter-library loan.

But we also see it through IFLA’s different committees, focused on working together to help each other, and the field as a whole.

This all takes time and effort of course.

While this comes naturally to most, it’s still good to give – and receive – gratitude.

So for our 32nd 10-Minute International Librarian exercise – and our last of 2020 – say thanks to all those who have helped you.

Think of those who have freely offered advice, taken on tasks, provided resources or anything else that has made your work easier.

Of course, 10 minutes may not be very much for this, but you can at least list those who have given you ideas, time, or other support over the last year.

It’s a helpful way to remember how connected we are, and how much we benefit from working together.

Share your stories in the comments below.

Good luck!


This idea relates to the IFLA Strategy! Key Initiative 3.2: Support virtual networking and connections.

You can view all of our ideas using the #10MinuteInternationalLibrarian tag on this blog, and of course on IFLA’s Ideas Store! Do also share your ideas in the comments box.

Library Stat of the Week #49: Faced with Competition from Online Entertainment, Household Spending on Books Has Held Up Better Where Libraries are Stronger

In a three-part series to end our regular #LibraryStatOfTheWeek posts, we are looking at data around culture, and crossing this with information gathered by IFLA through the Library Map of the World.

Last week’s post – the first of the mini-series – therefore looked at the link between the strength of library fields (including how well used they are), and the share of household spending on culture that is dedicated to books.

This is a helpful indicator, especially in a digital age where different activities are competing for our free time and resources. Given that overall tendencies to spend on culture will be determined by a variety of external factors (earnings and disposable incomes for example), this can even be a more meaningful way of understanding the place of reading – and books – in societies.

Libraries themselves have an important role in promoting reading, both in terms of helping adults discover new works, and in ensuring that coming generations turn into capable and confident readers.

This week, we look beyond the figures for one year (2015), and rather at evolutions in spending between the two years for which data is available – 2010 and 2015. This allows us to see how well spending on books, as a share of overall household cultural spending, has fared at a time that new online cultural activities were emerging.

Once again, data on household cultural spending comes from Eurostat (and so focuses only on European countres), while data on libraries and use comes from the IFLA Library Map of the World (latest available year), crossed with population data from the World Bank in order to obtain per capita figures. In each of the analyses noted below, we have only included a country when all relevant data was available.

Graph 1: Public/Community Libraries per 100 000 People and Change in Share of Household Cultural Spending on Books

Graph 1 starts by comparing numbers of public and community libraries per 100 000 people with the change in the share of household cultural spending going on books between 2010 and 2015.

In the graph, each dot represents a country. The higher it is, the more positive the change in share of spending has been. The further to the right it is, the more libraries there are per 100 000 people.

It is worth noting that, in all countries covered by this data, the share of household cultural spending going on books has fallen. This makes sense, given the points set out above concerning the rise of online entertainment.

The graph indicates that, in general, countries with higher numbers of public and community libraries per 100 000 people have tended to see smaller falls in the share of cultural spending going on books.

Graph 2: Public/Community Library Workers per 100 000 People and Change in Share of Household Cultural Spending on Books

Graph 2 looks rather at numbers of public and community library workers per 100 000 people. Dots further to the right on this graph therefore indicate countries with a higher number of such workers.

Here too, the story is positive – where there are more public and community library workers, in general, falls in the share of household cultural spending going on books have been lower. In other words, book sales have resisted better to competition where libraries are stronger.

Graph 3: Public/Community Visits per Capita and Change in Share of Household Cultural Spending on Books

Graph 3 looks at numbers of visits per person to public and community libraries. This shows a relatively strong, positive correlation between library use and changes in the share of household cultural spending going on books.

This tallies with the finding last week that library visits, in particular, seem to be well-connected to the economic situation of the book sector. This makes sense – libraries can be important shop-windows, and of course also build enthusiasm for reading.

Graph 4: Library Book Loans per Capita and Change in Share of Household Cultural Spending on Books

Graph 4 looks at average numbers of book loans per capita. Again, there is a positive correlation – and indeed a stronger and more positive one than in the graph last week looking at spending in just one year.

In other words, library lending tends to be associated with better performance over time for the book sector.

Graph 5: Change in Share of Household Cultural Spending on Books and Share of Registered Library Users in the Population

Graph 5, finally, looks at connections between numbers of registered library card holders (calculated as a share of the population), and trends in the share of books in total household cultural spending.

This again shows a positive correlation, although a less strong one, although partly driven by the result for Spain, where there is a high rate of library card holding, but also a big fall in spending on books as a share of overall cultural spending.


Overall, these figures provide further helpful support for advocacy around the value of our institutions in supporting a healthy book sector.

While correlation does not mean causality, it is possible to show that, far from greater library use being associated with lost tales, it is rather the opposite. These figures can be used in arguments to show that cuts to libraries – for example making it more difficult to visit and borrow – could be harmful to the book sector as a whole.


Find out more on the Library Map of the World, where you can download key library data in order to carry out your own analysis! See our other Library Stats of the Week! We are happy to share the data that supported this analysis on request.

The 10-Minute International Librarian #31: Think about what you can offer others in the field

The last months of the year are marked in a variety of cultures by festivals with a strong emphasis on giving.

Much of the time, this is about physical gifts, money or blessings.

But we can also give in other ways – of our time, our experience, and our energy.

IFLA depends heavily on library workers from around the world being ready to give in this way, to help others learn, improve practice, and advocate effectively.

Volunteering is indeed a great form of generosity!

So for our 31st 10-Minute International Librarian, think about what you can offer others in the field.

What particular skills or experience do you have that you can share? What resources have you created, or what connections can you make?

Can you support someone directly, for example as a mentor or coach? Or can you help more broadly by helping out with a project run by one of our professional units, or your own association?

Share your stories of the generosity of other members of our field in the comments below!

Good luck!


This idea relates to the IFLA Strategy! Key Initiative 2.3: Build a strong presence in international organizations and meetings as a valued partner.

You can view all of our ideas using the #10MinuteInternationalLibrarian tag on this blog, and of course on IFLA’s Ideas Store! Do also share your ideas in the comments box.

Get ready to start 2021 with #1Lib1Ref!

While 2020 is winding down, libraries and librarians around the world are already busy preparing for the 2021 edition of the Wikimedia Foundation’s #1Lib1Ref campaign.

Divided into two sessions, the #1Lib1Ref Campaign will take place from  15 January to 5 February 2021 and from 15 May to 5 June 2021.

The Wikimedia Foundation aims to gather and share knowledge in a simple, reliable way. In many ways, its missions can be considered as complementary to those of libraries: to provide access to information to all, foster freedom of speech, support communities, and reduce digital literacy gaps.

The #1Lib1Ref Campaign (one librarian, one reference) involves libraries and the librarian community, and focuses on ensuring that there are sources for all information included in Wikipedia. In this way, it creates an opportunity for all libraries and citizens to ensure the availability of reliable information online.

Why #1Lib1Ref continues to be a key area of engagement?

At a time that fact-checking and identifying reliable sources of information are a challenge for many, #1Lib1Ref is an opportunity for libraries to address these issues with their communities. This will contribute to providing better and more reliable information to all.

Libraries have an incredible amount of resources gathered in their collections, offering unique possibilities to provide insights on a huge variety of subjects. These resources can be key elements in structuring information on Wikipedia, yet they are not always fully used.

This matters because Wikipedia articles are sometimes the first point of entry to an unknown subject. Profiling resources on a specific topic ensures that this entry point offers a higher quality experience for readers who are looking for more information.

While some sources can be found online, many specialist articles and publications require access to broad resources, such as printed copies or e-resources, that are only available inside the libraries’ walls. This will be particularly true in the case of national and specialist libraries which hold unique collections – especially of cultural heritage – which are not available to access online.

Involving citizens and library users can also build capacities in information literacy. And, of course, given that the amount of information provided without reliable sources is so extensive, we can only hope to tackle it meaningfully with the involvement of all library users and citizens.

Where to start with #1Lib1Ref?

First of all, it is easy to participate in #1Lib1Ref, either online or in your library. Among the different possibilities, here are just a couple:

Option 1: Engage your colleagues and other libraries

First of all, you can engage librarians in your library themselves to contribute one source per day through the duration of the event. It is easy for libraries to get involved and encourage staff to edit Wikipedia (or even Wikidata, for the braver ones).

Simple instructions can be found on the #1Lib1Ref website.

Option 2: Engage with your library community

If you want to go further, you can create an event within your library! This event can be integrated into a specific theme in your cultural programming, based on your field, or a general topic.

in this case, you can communicate with your communities to invite them to join via social media, through your newsletter, or via information boards in your library or online.

Take a look at the resources on the website to find out more, and think about how you can engage your community, provide support or invite colleagues that might lead your event!

Let us know about our plans in the comments below!

Library Stat of the Week #48: In Countries with Stronger – and Better Used – Public and Community Library Fields, Books Account for Larger Shares of Household Spending on Culture

After a couple of weeks’ break, we’re back with a final mini-series of Library Stat of the Week posts, focusing this time on libraries and cultural data.

Cultural data itself is unfortunately not as widely collected as other types of data, partly because of a lack of widely adopted shared standards,  partly because – wrongly, we would suggest – it is not always a priority for statistical offices.

Fortunately, within the European Union, there is an effort to collect relevant information, looking at key questions such as how much households and governments are spending on culture, and how much people are benefitting from it.

Therefore, to close out our weekly series of library statistics posts, we are crossing data from the European Union’s Eurostat agency with data from IFLA’s Library Map of the World and the World Bank.

In this week’s post, we will look at the relationship between different public and community library indicators, and the share of total spending on cultural goods and services that goes on books.

The indicator of the share of total spending on books is useful, as it allows us to control for overall spending on culture in the population, which can vary strongly.

It also allows us to account for the fact that, arguably, different forms of culture are competing for our attention and available budgets. In other words, we can look at whether a stronger library field means that books ‘capture’ a larger share of cultural spending, a point that will be of interest, in particular to publishers and others in the book chain.

Data on spending on cultural goods and services comes from Eurostat’s database on mean expenditure by households on different goods and services. Data comes from 2015. Data on libraries comes from the Library Map of the World (most recent year), with World Bank population data (2018) used to allow us to calculate per capita figures.

As such, it is important to note that all data comes from European countries, but still allows for a look across a range of different library fields, and so can be useful for wider advocacy.

Graph 1: Public/Community Libraries per 100K People and Share of Cultural Spending on Books

Graph 1 starts by looking at shares of spending on books in total cultural spending in comparison with numbers of public and community libraries per capita.

In the graph, each point represents one country. The further to the right a point is, the more public and community libraries there are per 100 000 people, and the first up it is, the higher the share of books in overall household spending on cultural goods and services.

Looking at numbers of libraries gives an idea of how readily accessible libraries are to people, although of course does allow us to understand how well-supported each library is.

Overall, it appears then that there is a slight but small positive correlation between numbers of libraries and share of cultural spending on books.

Graph 2: Public/Community Library Workers per 100K People and Share of Cultural Spending on Books

Graph 2 looks at numbers of public and community library workers (full-time equivalents), arguably a stronger indicator of the strength of library fields.

This shows a slightly stronger, slightly more positive correlation, suggesting that where there are more public and community library workers, books account for a greater share of household spending on cultural goods and spending.

However, in addition to looking at ‘inputs’ to a strong library field (i.e. number of libraries and staff), we can also look to understand how well they are used. Library Map of the World data on numbers of visits, loans and registered users can help in this regard.

Graph 3: Visits to Public/Community Libraries per Person and Share of Cultural Spending on Books

Graph 3 therefore compares the average number of visits to public and community libraries per person per year with data on the share of household spending on cultural goods and services that goes on books.

This shows a stronger and more positive correlation still between use of libraries and spending on books. This would certainly vindicate the idea that libraries serve as venues for discovery of books, and so drive sales.

Graph 4: Average Book Loans per Person and Share of Cultural Spending on Books

Graph 4 repeats the exercise for loans of books. Once again, there is a positive correlation, although this is slightly less strong than for visits to libraries.

The fact that the connection is positive is nonetheless encouraging. Importantly, it is not negative!

Graph 5: Share of Population Registered at a Library and Share of Cultural Spending on Books

Finally, graph 5 looks at the share of the population that is a registered library user. Once again, the correlation is positive, but slightly less strong than for the numbers of visits.

The weaker connection here could perhaps be associated with the fact that simply being registered is only a proxy for intensity of library use.


As ever, correlation does not mean causality, and so we cannot necessary say that stronger – and better used – public and community library fields mean that books account for a greater share of household cultural spending.

Nonetheless, they do show that the two often come together. In particular, the strongest connections appear to be with the most meaningful indicators of library use – visits and loans.

This data is therefore a useful reference in advocacy around libraries contributing to, rather than holding back, the economic success of the book sector.


Find out more on the Library Map of the World, where you can download key library data in order to carry out your own analysis! See our other Library Stats of the Week! We are happy to share the data that supported this analysis on request.

European Commission releases key proposals: Digital Services Act and Digital Markets Act

On the 15th of December 2020, the European Commission launched its long-awaited reform on the regulation of major online platforms, the Digital Services Act (DSA). This comes alongside a proposal named the Digital Markets Act (DMA) which aims to address concerns about competition (or a lack thereof) in the technology sector and its impacts.

At the beginning of its mandate, the European Commission made a commitment to reform several aspects of the European market with regards to illegal online content and issues of competitiveness of major platforms online.

As part of this process, in June and September 2020, IFLA submitted suggestions and recommendations on the Digital Services Act to underline the interests of libraries as users of online services and to address their needs and expectations regarding the continuity of their core missions: provide an effective access to information and foster freedom of expression.

Initially combined within a single reform, the European Commission has finally decided to tackle these subjects independently. After several months of waiting, the European Commission launches its reform with two documents: the Digital Services Act and the Digital Markets Act.

The Digital Services Act: regulation of illegal content

The Digital Services Act reform aims to improve the single market within the European Union by developing a more coordinated response to illegal contents online. In doing so, it sets out the goals of maintaining the balance between tackling such content with protection of the fundamental rights of users, and facilitating the development of a competitive single market online.

20 years after the e-Commerce directive which established, among other things, the concept of exemption from liability of intermediary service providers, the new regulation proposes to maintain this key concept.

Online service providers will, if the proposal remains as it is, remain exempt from accountability in order to maintain and support citizens’ ability to express themselves and access information online.

This appears welcome.

To do so, they will need to make efforts to address illegal content, including efforts to prevent its reappearance. This includes violent and/or discriminatory contents relating to race, gender, age, religion.

For example, the DSA establishes due diligence obligations for flagging illegal content for all intermediary services with regards to the size and type of platforms.

The DSA also mentions that contents will not be controlled prior to publication, thus respecting the right of users to express themselves online. However, this leaves open many questions about the technical aspects that the implementation of this reform will take.

Regarding the process of takedown notices, the support of the Commission for a balanced judicial process is welcome. IFLA has strongly underlined the importance of respecting fundamental rights in the process of moderation of content, to let citizens benefit from their rights equally online and offline. Linked to this topic, the call for transparent and independent processes is also welcome.

The proposals evoke the possibility of national action in addition to European. While some issues will be developed at EU level, Member States are invited to develop national regulatory authorities for the digital space, with the power to order intermediaries to take content offline, and impose financial penalties.

Overall, the European Commission’s proposals seem welcome, given that they recall the importance of the protection of fundamental rights (e.g freedom of expression and freedom of access to information), the concept of online anonymity, and the importance of “transparency, information obligations and accountability of online service providers”.

The Digital Markets Act: competition regulation of “core platform services”

The Digital Markets Act mainly concerns major online platforms, also called “systemic stakeholders” that act as an intermediary between businesses and users, with the aim of limiting anti-competitive practices.

These include online intermediation services such as:
search engines
social networking
video sharing platforms services
number-independent interpersonal electronic communication services
operating systems
cloud services
and advertising services.

The objective is simple: to foster the emergence of new companies by addressing the harmful effects of monopolistic behaviour by major players online through measures that promote competition.

These proposed measures differentiate between two aspects of major platforms’ positions: the first one as a provider of a service to another business (for example one selling its products through an online marketplace) and the second as the provider of a service potentially in in competition with the same business , potentially enjoying an unfair advantage thanks to the data it gathers through its role as a service provider.

The views of the European Commission regarding proportionality, promoting “innovation, high quality of digital products and services, fair and competitive prices, and free choice for users in the digital sector” are welcome. A greater variety of platforms and offers of information and other services is likely to facilitate the work of libraries.

The concept of interoperability is also recognised as important and small and medium sized enterprises must be able to migrate to competing services. Nevertheless, little is said about individual users.

Good perspectives but a long way to go before a definitive document

IFLA continues to study these documents and remains aware that a deeper analysis is necessary in order to provide helpful solutions to next steps.

With the retention of the concept of exemption from the liability principle of global platforms and targeted recommendations to address a balanced EU response between user rights, respect for fundamental rights, and concepts of competitiveness, this is a welcome proposal.

We encourage the European Commission to consider in depth interoperability issues which impact on individual citizens. Libraries deeply support fundamental rights, including the ability of citizens to choose freely themselves, including online.

However, the devil always lies in the details and reflection on the technical aspects of such suggestions to achieve these objectives does not mean effective practical realisation.

Read more about it:  here, here and here, here, here