Today marks the beginning of School Library Month, and so it’s a great moment to be looking at available data about the connections between libraries and school performance at the global level.
In last week’s Library Stat of the Week, we used Library Map of the World data concerning numbers of school libraries and compared it with data from the Organisation for Economic Cooperation and Development’s Programme for International Student Assessment (OECD PISA).
This week we look further into the PISA data, in particular that from the 2009 assessment which included a number of questions focused on libraries. While this data was the subject of brief analysis in reports published at the time, little else appears to have been written about this.
PISA as a whole is based not only on practical tests of students’ ability in reading, maths and science, but also includes a lot of contextual questions about issues such as students’ background, habits, and the resources available to them.
As such, the results make it possible to look directly for links between reading performance and the presence and use of libraries in schools, based on results from the same students.
This week, therefore, we start by looking at the overall connections between whether students report having access to libraries, and average literacy scores.
Graph 1 displays this for all countries providing data. The length of the bars indicates the difference in points on the PISA reading scale between 15-year-olds reporting that they do, and do not, have access to a library.
A longer red bar to the right indicates a larger gap in favour of 15-year-olds with access to a library, whereas a blue bar to the right indicates a gap in favour of 15-year-olds without access to a library.
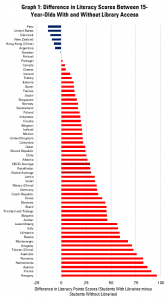
The key lesson from here is that across all of the countries surveyed, there is, on average, a 30 point gap in favour of 15-year-olds with access to a library. This represents roughly a year’s worth of education.
At the top end, Hungary and France both indicate score differences of over 90 points (around 3 years of learning), and a further seven countries have score differences over 60 points (around 2 years). Only seven countries see students reporting no access to libraries as scoring higher than those who do.
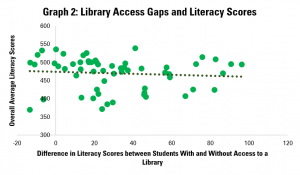
Graph 2 looks further, comparing the figures shown in Graph 1 (on the horizontal (x) axis) with the overall average reading score for each country (on the vertical (y) axis).
Interestingly, this indicates that there is very little connection between the two, implying that at almost every level of overall literacy performance, the positive advantage in favour of students with access to libraries is the same.
Graph 3 digs into the different aspects of the OECD’s measure of reading. In effect, PISA breaks down literacy into three key aspects: access and retrieve information (i.e. find key information within texts), integrate and interpret (understand the meaning of what is said), and reflect and evaluate (cross what is read within texts with existing knowledge).
It also includes scores for both continuous texts (such as articles or books) and non-continuous text (such as often found on websites).
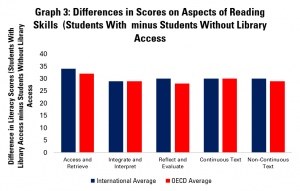
Once again looking at the gap between the performance of 15-year-olds who do and do not report having access to a library, the Graph shows relatively little variation across the different skills. The strongest connection between access to libraries and skills is on ‘access and retrieve’, which may well make sense in connection with the sort of extensive region that libraries can offer.
Overall, the figures here are clearly welcome in terms of supporting arguments about the value of access to libraries. Clearly, correlation is not the same thing as causality, and it is likely that schools and communities that offer libraries may well also invest in offering other forms of support.
Find out more on the Library Map of the World, where you can download key library data in order to carry out your own analysis! See our other Library Stats of the Week! We are happy to share the data that supported this analysis on request.