Last week’s Library Stat of the Week looked at how many researchers and students each academic or research library worker had to serve.
A point mentioned in the conclusions was the fact that from one country to the next (and indeed, from one institution to the next), there may be more focus on teaching students or on carrying out research.
Similarly the work of libraries can vary, for example, from helping undergraduates develop information literacy skills, to helping post-graduates manage datasets and find effective venues for publication.
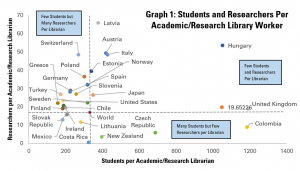
We can get a little more insight into this question by comparing the numbers of students and researchers per academic or research librarian – effectively the figures from Graphs 2a and 2b of last week’s post.
The results of this are shown in Graph 1.

This gives a degree of insight into the different communities that libraries are serving. Using the global average (World) as a reference point, we can assess in which countries academic library workers serve more (or less) students or researchers than average.
Those countries in the bottom left part of the graph are where there are relatively low numbers of students and of researchers per librarian. Therefore, in Slovakia, Mexico and Costa Rica, it is possible to see that students and researchers are relatively well served.
In the top left box, we see countries where there are a relatively low number of students per librarian (implying more possibility to provide services), but a higher number of researchers per librarian. In the bottom right, it is the inverse, with few researchers, but more students per librarian.
Finally, in the top right box, we have those countries where the average librarian has to support an above-average number of students or researchers.
Another point highlighted in last week’s blog was the fact that to some extent, the number of librarians per researcher or student is of course influenced by the number of researchers or students overall in the population.
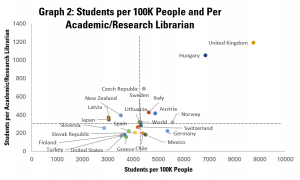
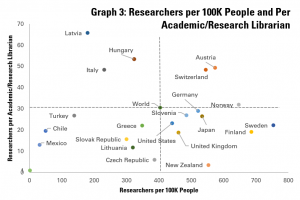
Graphs 2 and 3 explore this further by comparing numbers of students and researchers per academic library worker with the number of students and researchers per 100 people.

Graph 2 starts by looking at the situation for students, and once again uses the world averages (across available data) as a reference point.
Countries in the bottom right hand box combine both a high number of students and a high number of librarians per student (or low number of students per librarian). We can conclude, then, that students in Mexico, Chile, Germany and Lithuania are both numerous and well served.
In contrast, countries in the top left hand box have both relatively few students and fewer librarians per student. Countries in this situation include Japan, Latvia and New Zealand.
The bottom left hand box is for countries with few students, but a strong library service, while in contrast, those in the top right have a big tertiary education sector, but relatively few librarians to serve it.

Graph 3 looks at researchers, following the same principle. On this graph, countries in the bottom right hand box are those which have both a strong research population, and lots of librarians to serve it. Countries in this situation include New Zealand, the United Kingdom, the United States, Slovenia, Germany, Japan, Finland and Sweden.
In contrast, countries in the top left-hand box have both few researchers and few librarians there to support them. This is the case for Hungary and Italy.
Finally, the bottom right-hand box is for countries with a relatively small research community (but one that is well supported), and the top left for countries with larger numbers of researchers, but lower levels librarian support.
The figures shared in this post have allowed us to build up a more detailed sense of the size of academic and library research fields compared to the communities that they support. Next week, we will return to figures on publications and look at tertiary education completion rates.
Find out more on the Library Map of the World, where you can download key library data in order to carry out your own analysis! See our other Library Stats of the Week! We are happy to share the data that supported this analysis on request.