Monthly Archives: July 2020

Library Stat of the Week #29: Mexico, Slovakia and Lithuania have high numbers of academic librarians both per student and per researcher

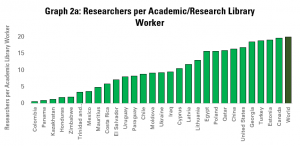
Last week’s Library Stat of the Week looked at how many researchers and students each academic or research library worker had to serve.

A point mentioned in the conclusions was the fact that from one country to the next (and indeed, from one institution to the next), there may be more focus on teaching students or on carrying out research.

Similarly the work of libraries can vary, for example, from helping undergraduates develop information literacy skills, to helping post-graduates manage datasets and find effective venues for publication.

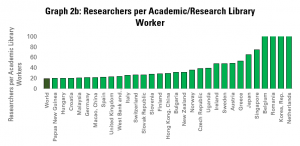
We can get a little more insight into this question by comparing the numbers of students and researchers per academic or research librarian – effectively the figures from Graphs 2a and 2b of last week’s post.

The results of this are shown in Graph 1.

Graph 1: Students and Researchers per Academic/Research Librarian

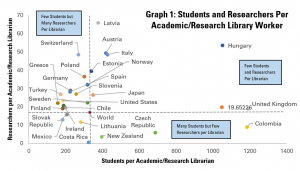
This gives a degree of insight into the different communities that libraries are serving. Using the global average (World) as a reference point, we can assess in which countries academic library workers serve more (or less) students or researchers than average.

Those countries in the bottom left part of the graph are where there are relatively low numbers of students and of researchers per librarian. Therefore, in Slovakia, Mexico and Costa Rica, it is possible to see that students and researchers are relatively well served.

In the top left box, we see countries where there are a relatively low number of students per librarian (implying more possibility to provide services), but a higher number of researchers per librarian. In the bottom right, it is the inverse, with few researchers, but more students per librarian.

Finally, in the top right box, we have those countries where the average librarian has to support an above-average number of students or researchers.

Another point highlighted in last week’s blog was the fact that to some extent, the number of librarians per researcher or student is of course influenced by the number of researchers or students overall in the population.

Graphs 2 and 3 explore this further by comparing numbers of students and researchers per academic library worker with the number of students and researchers per 100 people.

Graph 2: Students per 100K, and per Academic/Research Library Worker

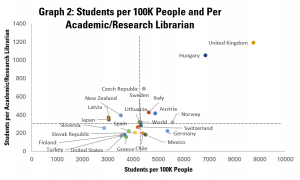
Graph 2 starts by looking at the situation for students, and once again uses the world averages (across available data) as a reference point.

Countries in the bottom right hand box combine both a high number of students and a high number of librarians per student (or low number of students per librarian). We can conclude, then, that students in Mexico, Chile, Germany and Lithuania are both numerous and well served.

In contrast, countries in the top left hand box have both relatively few students and fewer librarians per student. Countries in this situation include Japan, Latvia and New Zealand.

The bottom left hand box is for countries with few students, but a strong library service, while in contrast, those in the top right have a big tertiary education sector, but relatively few librarians to serve it.

Graph 3: Researchers per 100K People and per Academic/Research Library Worker

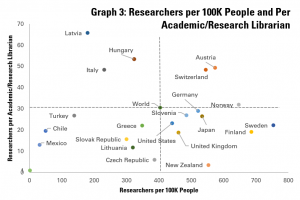
Graph 3 looks at researchers, following the same principle. On this graph, countries in the bottom right hand box are those which have both a strong research population, and lots of librarians to serve it. Countries in this situation include New Zealand, the United Kingdom, the United States, Slovenia, Germany, Japan, Finland and Sweden.

In contrast, countries in the top left-hand box have both few researchers and few librarians there to support them. This is the case for Hungary and Italy.

Finally, the bottom right-hand box is for countries with a relatively small research community (but one that is well supported), and the top left for countries with larger numbers of researchers, but lower levels librarian support.


The figures shared in this post have allowed us to build up a more detailed sense of the size of academic and library research fields compared to the communities that they support. Next week, we will return to figures on publications and look at tertiary education completion rates.


Find out more on the Library Map of the World, where you can download key library data in order to carry out your own analysis! See our other Library Stats of the Week! We are happy to share the data that supported this analysis on request.

Attitudes and Actions: What Might COVID-19 Change in the Way We Think?

For all that anyone would like to be purely objective or rational, we are all influenced by our attitudes. Consciously or sub-consciously, we tend to have preferences for certain ideas, values, or types of behaviour, which help shape our decisions.

This is why such a key focus of library advocacy is how we change people’s attitudes, in order to ensure that, when a key decision-moment comes, this is as favourable as possible for our services.

Yet of course, attitudes do not just shape the decisions of politicians or funders, but also affect choices within the library field, as well as those taken by users.

Moreover, while advocacy can take time, sometimes attitudes can be changed or shaped by relatively sudden events. The COVID-19 pandemic is likely to be no exception here.

So what attitude changes could we expect as a result of the pandemic, and how might these in turn affect the way that libraries work? This blog shares some initial ideas, and welcomes further reflections.


Interpersonal Relations: for many, the COVID-19 pandemic has changed the way they think about contacts with others. From efforts to avoid other people when going to the shops, limitations on the size of gatherings, or simply socialising online without a shared activity as a reference point, the way many people relate with others has changed. Especially for those living alone, this has been hard.

The long-term change in attitudes from this may vary from person to person. Some will want to return to ‘normal’ as quickly as possible, even at the risk of causing new peaks in cases. Others will remember the warnings, even after official restrictions are lifted.

Libraries are likely to have both types of people among their users, which of course does not necessarily make life easier. There does risk being a need to find ways to enforce rules in the case of users who are putting others at risk, which is clearly not an easy thing to do.

But there may also be a case for finding ways to meet the needs of users who remain concerned, for example through smaller group or individual support, or use of digital, in order not to lose contact in the long-term. This can require extra resources, depending on the degree to which some users risk staying away. Assessing how lasting this attitude change will be is best done at the local level.


Greater openness to digital: perhaps uniquely, compared to any previous crisis, the COVID-19 pandemic has underlined the potential of digital to provide alternatives to physical activities or services. Clearly, for those without internet connections, the potential has remained unrealised – a major priority for action in the future.

Among libraries in particular, we have seen great examples of uses of digital technologies, including innovative applications such as the use of Google Forms to create virtual escape rooms. Yet a lot of the time, the changes have been less about ‘new’ innovation, but rather the application of pre-existing digital tools in the library context.

Effectively, the pandemic appears to have accelerated the adoption of digital, bringing activities such as consultations via WhatsApp, online chats with librarians, or virtual storytimes forward. This may be testimony to a change in attitudes – a greater openness to apply technologies on the ground on the part of libraries, and a greater readiness to use them on the part of users.

The rises noted in numbers of registrations for library cards, and then use of digital resources would back this up. These resources were available before, but people preferred to use physical options. The pandemic has forced them to reconsider. A key question will be whether libraries and users stick with these digital options into the future – in other words, is the attitude change lasting?


Connectivity as a human right?: linked to changing attitudes to digital tools – both on the side of libraries themselves and that of their users – is awareness of the importance of being able to get online in the first place. In particular in the most connected societies, the pandemic has underlined the risks of being on the wrong side of the digital divide.

Students in particular who have not been able to get online have been very clearly left behind, while those already lucky enough to have connections have been able to continue with their learning. People needing to apply for unemployment benefits have found it harder to do so when requests can only be made online.

There is also growing awareness of the importance of decent internet connectivity, with excessively low thresholds meaning that people who cannot make meaningful use of the internet are still counters as connected, and so do not receive support.

While the continued failure to give everyone options for meaningful connectivity has been around for some time, the pandemic has brought this into focus. There is perhaps hope that, in the wake of the crisis, there will be a greater readiness to see connectivity in the same way that we see access to running water, and support efforts to provide it effectively.

Libraries, both as centres for getting online, and nodes in networks, can be part of this.


Greater respect for science: another potential change relates to the readiness of policy-makers not just to draw on evidence, but also to be seen to be drawing on evidence, in order to justify the decisions they take.

This follows a number of years of concern about ‘fake news’, and the seeming rise of a class of politician almost taking pride in ignoring what ‘the experts’ say. Depressingly, for a field built on the idea of the importance of gathering, organising, preserving and applying information, these politicians have seemed to do well in elections.

While this group of politicians have clearly not left the scene, at least in some cases, there is a sense that it is both safer and wiser to draw on expertise in order to define policy. Whether this is sincere is open for discussion, but it is certainly welcome for libraries, at least for as long as it lasts.


The internet needs regulating?: a final potential change in attitudes returns to the digital sphere. We have seen, over a number of years, a growing sense that the internet has both its upsides and downsides for society.

Connected to this, we have seen increasing efforts to try and regulate the internet, and in particular its biggest platforms, as a means of trying to minimise the negatives, albeit in a piecemeal way. Legislation has looked at copyright, terrorist content, fake news, marketplaces and other issues, often taking different approaches to each.

However, when COVID-19 struck, the World Health Organization moved quickly to express concern about an ‘infodemic’ – the spread of misinformation about the virus, undermining public health messaging from governments.

Platforms have worked hard to respond, blocking, blurring, or tagging misleading messages as misleading.  It is perhaps not by accident that Twitter has felt readier to intervene in messages from the President of the United States now, even if these did not deal specifically with COVID-19.

With pressure in the United States to review rules around the liability of platforms, and legislation already under discussion on the same point, there is a chance that a greater readiness to regulate the internet could lead to sweeping new rules.

For libraries, this will be an area to follow closely. Clearly – as libraries know themselves – there can be types of content which are illegal or unacceptable. However, deciding where this is the case takes careful judgement, and legislation can be a blunt tool, which can unduly limit the scope libraries have to offer access to information.


These are just five areas where we may expect a change in attitudes as a result of COVID-19. All affect the way that libraries provide services, requiring innovation, adaptation and potentially advocacy.

None are certain of course. It remains to be seen how far attitudes change permanently, at a societal level. Do share your own views in the comments!

Filling the Evidence Gap: an Interview with Guy LeCharles Gonzalez, Panorama Project


The lending of eBooks by libraries remains an area of controversy, with libraries often facing high prices and difficult licencing conditions, while publishers worry about impacts on sales and revenues to authors.

A key challenge in this has been the relative newness of the format, and the lack of a shared evidence-base for understanding both eLending itself, and its interrelation with wider markets. The Panorama Project is aiming to address this. We interviewed Guy LeCharles Gonzalez, Project Lead, to find out more.


How well does anyone understand the eBook market and the place of libraries within it today?


The answer really depends on your perspective and priorities. The size of the overall consumer ebook market is difficult to measure because Amazon owns a significant percentage of it, especially on the self-publishing side, and they don’t publicly share any useful data. OverDrive is the dominant player on the library side, but NPD Bookscan doesn’t track ebook sales the same way they do print, and the American Association of Publishers (AAP) doesn’t break out library sales at all, so there’s no authoritative industry source for context.

Individual publishers generally have a good sense of where their ebook revenue comes from, but it’s mostly “last-click attribution” which heavily favors Amazon and OverDrive, and they generally don’t have a good sense of which factors might be impacting their consumer sales. They also don’t have deep data on what drives those sales, including the role of discoverability through libraries, nor any useful insights into print circulation. The combination of fragmentation and lack of transparency is one of the primary reasons the Panorama Project was initiated.


Why do you think that there is relatively little data out there?


Trade book publishing is a notoriously opaque industry, for a variety of reasons, including private ownership of most major publishers and intermediaries. Movies, music, and video games all have relatively transparent sales data that’s shared publicly and regularly dissected by their respective media outlets, but we rarely learn how many copies the latest New York Times’ (NYT) Bestsellers actually sold in any given week or year—unless it’s the rare breakout hit—despite it being one of the industry’s primary, albeit heavily curated and proprietary, measuring sticks. There are NYT Bestselling authors who’ve sold fewer copies of any book than the average middling video game, but they get to wear the badge anyway.


What impact has this had on the decisions that are being taken by different actors?


It’s led to some publishers making “data-driven” decisions about ebook pricing and access that lack proper context, potentially resulting in unintended changes to consumer behavior. Assuming library access is impacting consumer ebook sales and making strategic decisions based on that assumption is a risky bet—especially if Amazon is the primary source of the data driving that assumption. What if it’s not just library availability, but consumer ebook pricing, competition from other traditional publishers and self-publishers, or other forms of media, that is impacting your sales?

When you limit libraries’ access to your books, you cut off an important discovery and consumption channel for a segment of your audience. And when you do that purposefully, you’re as likely to drive readers to either wait until it’s available or borrow another book they’re interested in that is available, as opposed to converting them to buyers in another channel. If there was more transparency around sales data, and more understanding about discovery and purchase paths, the question of libraries’ actual impact would be a much easier question to answer. That requires purposeful, good faith collaboration. 


Where do you see the Panorama Project as making a difference?


Our primary goal is to encourage more productive, good faith conversations about public libraries in general—from discovery and engagement to direct and indirect impact on sales—so the industry can come to a collaborative consensus on how to measure their impact, whether it’s positive or negative. Our various initiatives are designed to provide data-informed insights on that impact in specific areas, while building a foundation for more effective collaboration moving forward.


How does the Panorama Project work?


A cross-industry Advisory Council with members from Penguin Random House, Sourcebooks, Open Road Media, American Library Association, Audio Publishers Association, NISO, Ingram Content Group, and OverDrive, serves as a sounding board for potential and ongoing initiatives. They offer insight and expertise in different areas to ensure those initiatives can have a measurable impact, and align with Panorama Project’s mission. We partner with different publishers, vendors, and organizations on specific initiatives, and I personally consult with a number of colleagues and experts across the industry for feedback and insights to ensure we’re on the right track.


How international is it or could it be?


We’re currently focused on public libraries in the United States, but we have occasional conversations about potential opportunities to expand our reach as there is international interest in our work. There are no specific plans currently in development, although I’d love to hear feedback from anyone who has ideas.


Clearly, support from OverDrive as one of the major commercial players in the market will raise some eyebrows. Should it?


It’s a fair concern and one I shared when I was initially approached to take on the role as Project Lead. OverDrive identified the need, helped convene the Advisory Council, and brought me on to run things—but our work is never tied to any specific OverDrive agenda, and everything we produce is fully transparent and widely shared for the benefit of the overall industry. The Advisory Council includes members from Penguin Random House, Sourcebooks, Open Road Media, American Library Association, Audio Publishers Association, NISO, Ingram Content Group, and OverDrive. One of our primary research initiatives for 2020—the Immersive Media & Reading 2020 Consumer Survey—is in partnership with the Authors Guild, ALA, Book Industry Study Group, Independent Book Publishers Association, and PubWest. I expect that kind of collaboration will become the norm for all of our future initiatives. 


What findings have you already established?


Some of our early initiatives measured the positive impact of library access on consumer sales on specific titles, most notably debut author Jennifer McGaha’s Flat Broke With Two Goats (Sourcebooks, 2018), the subject of our Community Reading Event Impact Report. Our Readers’ Advisory Impact Committee researched, documented, and analyzed the wide variety of RA title and author recommendation activities used in public libraries, and produced the Readers’ Advisory Directory. That initiative led to further research on Public Library Events & Book Sales which identified major gaps in publishers’ understanding and valuation of the monetary value of those libraries’ organic and purposeful marketing activities. 


What current work are you most excited about?


Our two main initiatives for 2020—the Immersive Media & Reading 2020 Consumer Survey, and Library Marketing Valuation Toolkit—grew out of the realization that a lack of transparency around data in the publishing industry is a major obstacle to establishing an effective foundation for collaboration. I’m particularly excited about the consumer research because it’s been years since anyone’s taken a good look at how book readers’ behaviors have evolved in the wake of ebooks and audiobooks, not to mention other immersive media like streaming and gaming. We’ve partnered with Portland State University and assembled a cross-industry committee to collaborate on developing the methodology and the survey itself, ensuring that the findings will not only be credible, but actionable. COVID-19 forced us to adjust our timeline, but we’re expecting to field the survey in the early Fall and have initial findings published before the end of the year.


How do you see COVID-19 changing the landscape of library eLending?


In the short-term, we’ve already seen reports of increased engagement with libraries’ electronic resources which, of course, leads to increased spending to meet that demand. Unfortunately, few libraries are going to come out of this period with increased budgets, so hard decisions will need to be made about materials budgets across the country. The longer the pandemic lasts, the more likely temporarily modified consumer behaviors will become permanent preferences, so I suspect we’ll see an acceleration in engagement with, and increased spending on, digital content. If schools face a prolonged period of remote learning through the Fall and into Winter, even if it’s a hybrid approach, that acceleration will probably be even faster.


What are the next big questions needing answering to your mind?


The main questions I proposed at the end of 2019 remain unanswered, and are arguably even more critical to answer in light of current events.

  1. How much of public libraries’ estimated $1.5 billion overall materials budget goes toward trade publishing’s estimated $12 billion in projected revenue for 2019, and where does that rank against other channels?
  2. How much marketing value do public libraries create for publishers through readers’ advisory services, physical shelf and online catalogue visibility, hosted author events, and community book clubs?
  3. How do library patrons discover and acquire the books they read and in which formats, and how does that fit with other media consumption and buying habits?

We’ve taken steps towards helping answer the second and third questions with our 2020 initiatives, while the first one still requires a level of collaboration across the industry that we haven’t seen yet. I’m hopeful that we’ll be in a better position to answer that one in 2021.

The 10-Minute International Librarian #10: Find, and sign up to, a library blog

Libraries are at the heart of so many key discussions.

Information – and the changing ways in which it is collected, produced, presented, shared and used – is a top political issue.

With centuries of experience, libraries have so much to bring to any discussion

Of course, these changes also affect libraries, forcing us the library field to think deeply about the our role, and how we can best serve our communities.

These are often big questions, and it can be difficult to find the time to sit back and think through them.

But you’re not alone in doing so! There are lots of great people thinking and writing about the library field, from different backgrounds and points of view.

Reading what they have to say can be a great starting point for engaging in wider discussions.

So for our 10th 10-Minute International Librarian exercise, find and sign up to a library blog.

Think of interesting people you’ve heard speak or read about, or you could ask a friend or a colleague.

Try also to look for people with different perspectives. You don’t have to agree with what they say – disagreeing can be a great way to refine your own ideas.

Share your favourite ideas in the comments box below – you may just help someone else discover a great source of ideas!

Good luck!


This idea relates to the IFLA Strategy! Key Initiative 2.1 :Produce, communicate and distribute key resources and materials that inspire the profession .

As we publish more ideas, you will be able to view these using the #10MinuteInternationalLibrarian tag on this blog, and of course on IFLA’s Ideas Store! Do also share your ideas in the comments box.

Library Stat of the Week #28: On average, there are 305 students and 20 researchers per academic library worker

In recent weeks, we have looked at how numbers of academic libraries and library workers stand around the world, and what correlations there are between these, in relation to total populations, and indicators of innovation such as publishing and patenting.

Another angle worth exploring is the relationship between numbers of academic library workers, and those who benefit most directly from their services – students in tertiary education and people working in the research sector.

We can start to explore this by looking at data from the UNESCO Institute for Statistics on numbers of people working in research, and OECD data on the number of people registered in tertiary education, combined with data from IFLA’s Library Map of the World.

In each case, there is not data available for every country. In particular, OECD data is focused on its own members, with a few additional countries, meaning that averages offered are only relative to a part of the world.

Graph 1: Number of Students per Academic and Research Library Worker

Graph 1 looks at students. Students can benefit strongly from well-supported academic libraries, in order to help them benefit from well-designed collections, find resources effectively, and develop key skills.

The data available indicates that on average, each full-time academic library worker serves 207.7 students. The smallest number of students per librarian was in Germany – 157.6, with eight countries in total coming below the global average, of which seven are European, and the other is Canada.

Among other regions for which data is available, Colombia had the smallest number of students per librarian in Latin America and the Caribbean, and Japan in Asia-Oceania. There are some very high figures for numbers of students in some countries, which may be due to under-counting.

Graph 2a: Number of Researchers per Academic and Research Library Worker


Graph 2b: Number of Researchers per Academic and Research Library Worker

Graphs 2a and 2b look at research personnel (to note different scales on the vertical axis). As has been underlined in previous posts, libraries are a key part of the research infrastructure for any country, not only ensuring that researchers can access knowledge and ideas from elsewhere, but also increasing helping to ensure effective dissemination and management of data.

Globally, the data indicates that there are on average 20 research workers for every worker in an academic or research library.

The smallest number of academic and research library workers per researcher was in Colombia, with 0.6. Eight countries in total have fewer than five researchers per academic and research library worker – as well as Colombia, Panama, Kazakhstan, Honduras, Zimbabwe, Trinidad and Tobago, Mexico and Mauritius.

Meanwhile, a number of countries had figures of more than 100 researchers per academic or research librarian, although this may be down to under-reporting of numbers of librarians.


Clearly the profile of academic libraries themselves varies strongly, depending on institutions themselves. Some will focus much more on educating undergraduates, others much more on supporting more advanced research work.

As a result, a low number of researchers per librarian can be an indicator as much of a large number of librarians (because of strong investment in research libraries) as of a small number of researchers (because a institutions has relatively little focus on research, and more on teaching in general).

A similar reflection can apply to numbers of students. A system more focused on research may therefore employ more research librarians, raising the ratio of library workers to students, but so too could a smaller number of students.

We will explore these issues further next week.


Find out more on the Library Map of the World, where you can download key library data in order to carry out your own analysis! See our other Library Stats of the Week! We are happy to share the data that supported this analysis on request.

Building Understanding, Building Confidence: Interview with Chris Morrison on the University of Kent’s Copyright Literacy Strategy

Copyright can all too often seem complicated, scary, or both. Yet having a sense of what it does, and does not permit can help avoid accidental infringements, as well as preventing situations where library users do not take full advantage of the possibilities open to them.

Chris Morrison, at the University of Kent in the UK – co-owner of copyrightliteracy.org – has done extensive work on the subject, as well as co-developing games such as ‘Copyright, the Card Game’ in order to build confidence. He has also played a key role in developing a copyright literacy strategy at the University of Kent, UK. We interviewed him to find out more.


What is the state of copyright literacy currently among students, faculty and librarians?

This is difficult to say with certainty. But we did run a survey last year asking our academics how confident they felt in dealing with copyright issues and the majority didn’t feel as confident as they would like to. I certainly still get asked a lot of questions that show people still want clear guidance on how to address copyright issues.

How much appreciation was there of the need for a focused approach to copyright literacy?

As you know, this is something that Jane Secker (City, University of London and co-owner of copyrightliteracy.org) and I have been talking about for some time. Copyright is often not many people’s favourite subject, but when I started talking to colleagues about focussing on a clear institutional vision on copyright literacy they were all very supportive. Everybody seems to have some experience of working with copyright where they have or might benefit from institutional support.

For you, what is the value added of a strategy?

In the past I may have been a bit cynical about strategy documents. They can sometimes seem a bit vague – making obvious statements as part of a box ticking exercise. But after many years of working with copyright, I became convinced that going through a process of making a formal statement would be beneficial. It’s allowed me to present my vision and ideas to my colleagues and incorporate it with their experiences and ideas to create something which I think is really valuable.

What did you need to do to get to the stage of getting this drafted and approved?

We ran the development of the strategy as a project, getting together a representative working group of academic and professional services staff and holding a number of workshops. This allowed us to start off capturing lots of ideas before looking at specific position statements. I then shared drafts with student representatives, as well as experts and peers across the university sector and beyond,  before submitting to the formal approval process at Kent.

How are you approaching the question of balance between exclusive rights and enabling use?

Unsurprisingly this was one of the biggest areas of contention when developing the strategy. Universities use copyright content, but they also generate valuable intellectual property which they may want choose who gets access to and under what terms. When we realised that we weren’t trying to resolve this tension, but acknowledge it and help people make sense of it in the context of their own work, we were able to make progress.

What are you looking forward to most in the implementation?

Other than the satisfaction of a job well done it will be the ability to finally answer the question “but what does the University say about that”? I think this document reflects that a university, or any large institution has multiple perspectives, but that we should ultimately be focusing on our teaching, research and engagement.

What do you think will be most challenging?

We have a huge challenge in responding to the COVID-19 pandemic, so I think the interesting question is whether this strategy actually helps us to do the best work we can.

What does success look like in 5 years’ time?

We have a section on measuring success in the strategy. It’s a difficult thing to pin down in quantitative terms, but we’re planning on capturing lots of case studies and examples of where our approach has helped us.

Is this an experience that you think could be replicated elsewhere – both in the UK and globally?

Yes, I think it could. I’ve already received positive feedback from those who have seen the strategy, some of whom have said they are thinking of doing something similar. The strategy is available under a Creative Commons Attribution (CC BY) licence so others are free to adapt it if they want. But I would recommend going through a proper process of working out what statements might be right for your institution in collaboration with your colleagues and students or users of your library/information service. I certainly wouldn’t recommend adopting a strategy like this as a box ticking exercise.

The 10-Minute International Librarian #9: Think how you can support someone in their career

Connections and communications between libraries are a great way of learning.

IFLA is all about providing a space and opportunity to do this, across borders, between library types.

We all have things we can share with others, as well as ways we can gain by listening.

But this is particularly important for newer professionals, in order to help them gain knowledge and experience.

Indeed, we can make a major contribution to the future of our field by helping those who will lead it be ready to take on this responsibility.

So for our 9th 10-Minute International Librarian exercise, think how you can support someone in their career.

Can you share advice or experience?

If you have newer professionals working to you, what opportunities can you offer to take on responsibilities, and grow in confidence?

Perhaps you could become a coach or mentor, following the suggestions from IFLA’s Section on Continuing Professional Development and Workplace Learning?

Of course, actually providing support will (usually) take more than 10 minutes, but this should be long enough to come up with some ideas!

Feel free to share them as comments below!

Good luck!


This idea relates to the IFLA Strategy! Strategic Direction 3, Key Initiative 4: Work with library associations and libraries to identify key legal and funding challenges to their work, and advocate for action.

As we publish more ideas, you will be able to view these using the #10MinuteInternationalLibrarian tag on this blog, and of course on IFLA’s Ideas Store! Do also share your ideas in the comments box.